Alerting & Query Matching
In the following tutorial we’ll learn how to raise custom alerts on some http traffic (apache log records) based on lucene matching query criterion.
We assume that you already know how to parse and ingest Apache logs into logisland. If it’s not the case please refer to the previous Apache logs indexing tutorial. We will use mainly the MatchQuery Processor.
Note
Be sure to know of to launch a logisland Docker environment by reading the prerequisites section
1.Install required components
For this tutorial please make sure to already have installed elasticsearch modules.
If not you can just do it through the components.sh command line:
bin/components.sh -i com.hurence.logisland:logisland-processor-elasticsearch:1.1.2

bin/components.sh -i com.hurence.logisland:logisland-service-elasticsearch_5_4_0-client:1.1.2
2. Logisland job setup
The logisland job for this tutorial is already packaged in the tar.gz assembly and you can find it here :
docker exec -i -t logisland vim conf/match-queries.yml
We will start by explaining each part of the config file.
The stream contains two processors quite identical (the first one converts raw logs to records and the second one index records to ES) to those encountered in the previous Apache logs indexing tutorial tutorial .
The third one makes use of the MatchQuery Processor. This processor provides user with dynamic query registration. This queries are expressed in the Lucene syntax.
Note
Please read the Lucene syntax guide for supported operations.
This processor will tag the record with blacklisted_host field if the query src_ip:(+alyssa +prodigy) matches and tag montana_host if src_ip:montana
- processor: match_query
  component: com.hurence.logisland.processor.MatchQuery
  type: processor
  documentation: a parser that matches lucene queries on records
  configuration:
    policy.onmiss: forward
    policy.onmatch: all
    blacklisted_host: src_ip:(+alyssa +prodigy)
    montana_host: src_ip:montana
here is an example of matching record :
{
    "@timestamp": "1995-07-01T09:02:18+02:00",
    "alert_match_name": [
      "montana_host"
    ],
    "alert_match_query": [
      "src_ip:montana"
    ],
    "bytes_out": "8677",
    "http_method": "GET",
    "http_query": "/shuttle/missions/missions.html",
    "http_status": "200",
    "http_version": "HTTP/1.0",
    "identd": "-",
    "record_id": "8e861956-af54-49fd-9043-94c143fc5a19",
    "record_raw_value": "ril.usda.montana.edu - - [01/Jul/1995:03:02:18 -0400] \"GET /shuttle/missions/missions.html HTTP/1.0\" 200 8677",
    "record_time": 804582138000,
    "record_type": "apache_log",
    "src_ip": "ril.usda.montana.edu",
    "user": "-"
  }
3. Launch the script
For this tutorial we will handle some apache logs with a splitText parser and send them to Elastiscearch Connect a shell to your logisland container to launch the following streaming jobs.
docker exec -i -t logisland bin/logisland.sh --conf conf/match-queries.yml
4. Inject some Apache logs into the system
Now we’re going to send some logs to logisland_raw Kafka topic.
We could setup a logstash or flume agent to load some apache logs into a kafka topic but there’s a super useful tool in the Kafka ecosystem : kafkacat, a generic command line non-JVM Apache Kafka producer and consumer which can be easily installed.
If you don’t have your own httpd logs available, you can use some freely available log files from NASA-HTTP web site access:
- Jul 01 to Jul 31, ASCII format, 20.7 MB gzip compressed
- Aug 04 to Aug 31, ASCII format, 21.8 MB gzip compressed
Let’s send the first 500000 lines of NASA http access over July 1995 to LogIsland with kafkacat to logisland_raw Kafka topic
cd /tmp
wget ftp://ita.ee.lbl.gov/traces/NASA_access_log_Jul95.gz
gunzip NASA_access_log_Jul95.gz
head -500000 NASA_access_log_Jul95 | kafkacat -b sandbox:9092 -t logisland_raw
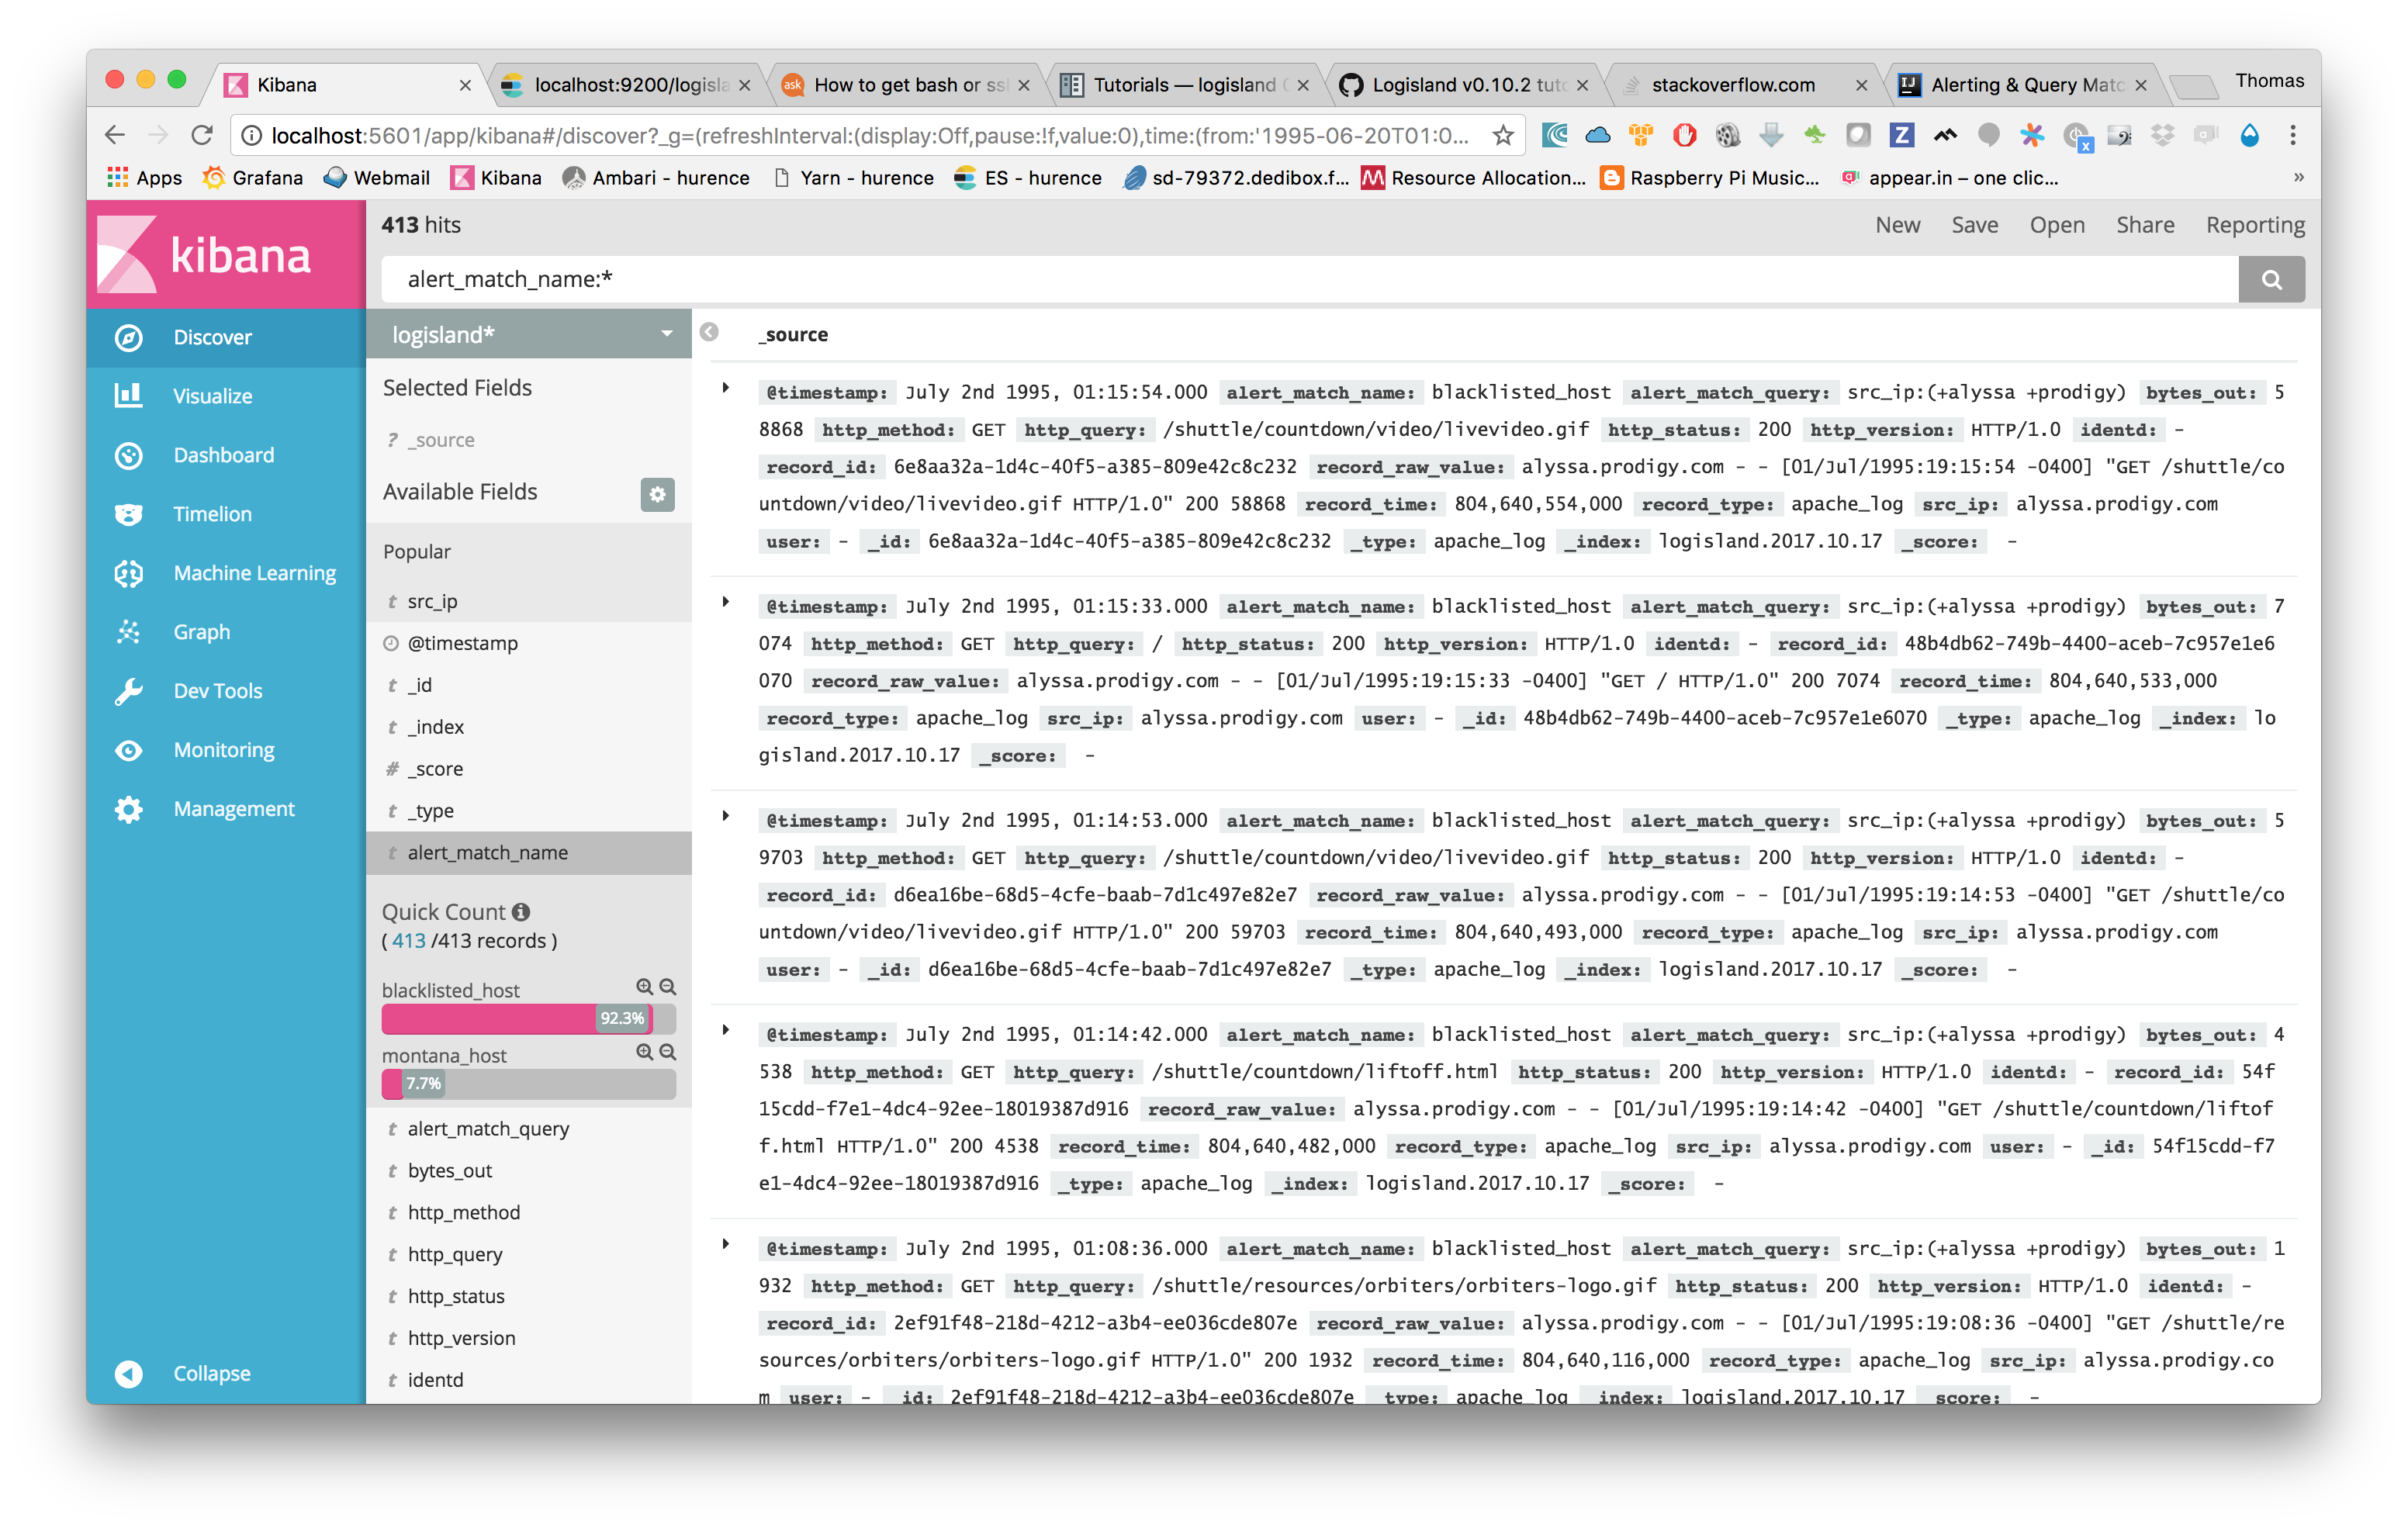
5. Check your alerts with Kibana
Check that you’ve match some criterias :
curl -XGET http://localhost:9200/logisland.2017.10.17/_search?pretty&q=alert_match_name:montana_host
curl -XGET http://localhost:9200/logisland.2017.10.17/_search?pretty&q=alert_match_name:blacklisted_host
Open up your browser and go to http://sandbox:5601/ and you should be able to explore your apache logs.
by adding filter on alert_match_name:blacklisted_host you’ll only get request from alyssa.prodigy.com which is a host we where monitoring.