Netflow/Logisland integration - Handling Netflow traffic
Netflow and Logisland
Netflow is a feature introduced on Cisco routers that provides the ability to collect IP network traffic. We can distinguish 2 components:
- Flow exporter: aggregates packets into flows and exports flow records (binary format) towards flow collectors
- Flow collector: responsible for reception, storage and pre-processing of flow data received from a flow exporter
The collected data are therefore available for analysis purpose (intrusion detection, traffic analysis...)
Network Flows: A network flow can be defined in many ways. Cisco standard NetFlow version 5 defines a flow as a unidirectional sequence of packets that all share the following 7 values:
- Ingress interface (SNMP ifIndex)
- Source IP address
- Destination IP address
- IP protocol
- Source port for UDP or TCP, 0 for other protocols
- Destination port for UDP or TCP, type and code for ICMP, or 0 for other protocols
- IP Type of Service
NetFlow Record
A NetFlow record can contain a wide variety of information about the traffic in a given flow. NetFlow version 5 (one of the most commonly used versions, followed by version 9) contains the following:
- Input interface index used by SNMP (ifIndex in IF-MIB).
- Output interface index or zero if the packet is dropped.
- Timestamps for the flow start and finish time, in milliseconds since the last boot.
- Number of bytes and packets observed in the flow
- Layer 3 headers:
- Source & destination IP addresses
- ICMP Type and Code.
- IP protocol
- Type of Service (ToS) value
- Source and destination port numbers for TCP, UDP, SCTP
- For TCP flows, the union of all TCP flags observed over the life of the flow.
- Layer 3 Routing information:
- IP address of the immediate next-hop (not the BGP nexthop) along the route to the destination
- Source & destination IP masks (prefix lengths in the CIDR notation)
Through its out-of-the-box Netflow processor, Logisland integrates with Netflow (V5) and is able to receive and handle Netflow events coming from a netflow collector. By analyzing those events with Logisland, you may do some analysis for example for intrusion detection or traffic analysis.
In this tutorial, we will show you how to generate some Netflow traffic in LogIsland and how to index them in ElasticSearch and vizualize them in Kinbana. More complexe treatment could bv done by plugging any Logisland processors after the Netflow processor.
Tutorial environment
This tutorial aims to show how to handle Netflow traffic within LogIsland.
For the purpose of this tutorial, we will generate Netflow traffic using nfgen. This tool will simulate a netflow traffic and send binary netflow records on port 2055 of sandbox. A nifi instance running on sandbox will listen on that port for incoming traffic and push the binary events to a kafka broker.
We will launch two streaming processes, one for generating the corresponding Netflow LogIsland records and the second one to index them in ElasticSearch.
Note
It is important to understand that in real environment Netflow traffic will be triggered by network devices (router, switches,...), so you will have to get the netflow traffic from the defined collectors, and send the corresponding record (formatted in JSON format as described before) to the Logisland service (Kafka).
Note
You can download the latest release of Logisland and the YAML configuration file for this tutorial which can also be found under $LOGISLAND_HOME/conf directory in the LogIsland container.
1. Start LogIsland as a Docker container
LogIsland is packaged as a Docker container that you can build yourself or pull from Docker Hub. The docker container is built from a Centos 6.4 image with the following tools enabled (among others)
- Kafka
- Spark
- Elasticsearch
- Kibana
- LogIsland
Pull the image from Docker Repository (it may take some time)
docker pull hurence/logisland
You should be aware that this Docker container is quite eager in RAM and will need at least 8G of memory to run smoothly. Now run the container
# run container
docker run \
    -it \
    -p 80:80 \
    -p 8080:8080 \
    -p 2055:2055 \
    -p 3000:3000 \
    -p 9200-9300:9200-9300 \
    -p 5601:5601 \
    -p 2181:2181 \
    -p 9092:9092 \
    -p 9000:9000 \
    -p 4050-4060:4050-4060 \
    --name logisland \
    -h sandbox \
    hurence/logisland bash

# get container ip
docker inspect logisland

# or if your are on mac os
docker-machine ip default
you should add an entry for sandbox (with the container ip) in your /etc/hosts as it will be easier to access to all web services in logisland running container.
Note
If you have your own Spark and Kafka cluster, you can download the latest release and unzip on an edge node.
2. Configuration steps
First we have to peform some configuration steps on sandbox (to configure and start elasticsearch and nifi). We will create a dynamic template in ElasticSearch (to better handle the field mapping) using the following command:
docker exec -ti logisland bash

[root@sandbox /]# curl -XPUT localhost:9200/_template/netflow -d '{
  "template" : "netflow.*",
  "settings": {
    "index.refresh_interval": "5s"
  },
  "mappings" : {
    "netflowevent" : {
      "numeric_detection": true,
      "_all" : {"enabled" : false},
      "properties" : {
        "dOctets": {"index": "analyzed", "type": "long" },
        "dPkts": { "index": "analyzed", "type": "long" },
        "dst_as": { "index": "analyzed", "type": "long" },
        "dst_mask": { "index": "analyzed", "type": "long" },
        "dst_ip4": { "index": "analyzed", "type": "ip" },
        "dst_port": { "index": "analyzed", "type": "long" },
        "first":{"index": "analyzed", "type": "long" },
        "input":{"index": "analyzed", "type": "long" },
        "last":{"index": "analyzed", "type": "long" },
        "nexthop":{"index": "analyzed", "type": "ip" },
        "output":{"index": "analyzed", "type": "long" },
        "nprot":{"index": "analyzed", "type": "long" },
        "record_time":{"index": "analyzed", "type": "date","format": "strict_date_optional_time||epoch_millis" },
        "src_as":{"index": "analyzed", "type": "long" },
        "src_mask":{"index": "analyzed", "type": "long" },
        "src_ip4": { "index": "analyzed", "type": "ip" },
        "src_port":{"index": "analyzed", "type": "long" },
        "flags":{"index": "analyzed", "type": "long" },
        "tos":{"index": "analyzed", "type": "long" },
        "unix_nsecs":{"index": "analyzed", "type": "long" },
        "unix_secs":{"index": "analyzed", "type": "date","format": "strict_date_optional_time||epoch_second" }
      }
    }
  }
}'
In order to send netflow V5 event (binary format) to logisland_raw Kafka topic, we will use a nifi instance which will simply listen for netflow traffic on a UDP port (we keep here the default netflow port 2055) and push these netflow records to a kafka broker (sandbox:9092 with topic netflow).
Start nifi
docker exec -ti logisland bash
cd /usr/local/nifi-1.1.1
bin/nifi.sh start
browse http://sandbox:8080/nifi/
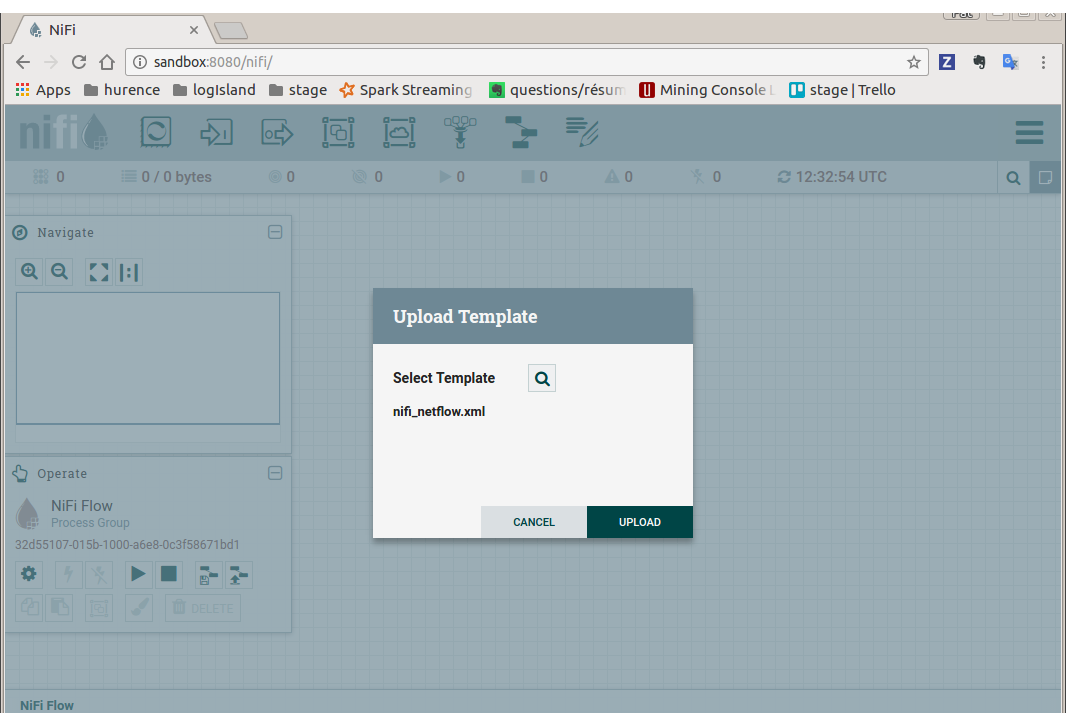
Import flow template
Download this nifi template and import it using “Upload Template” in “Operator” toolbox.
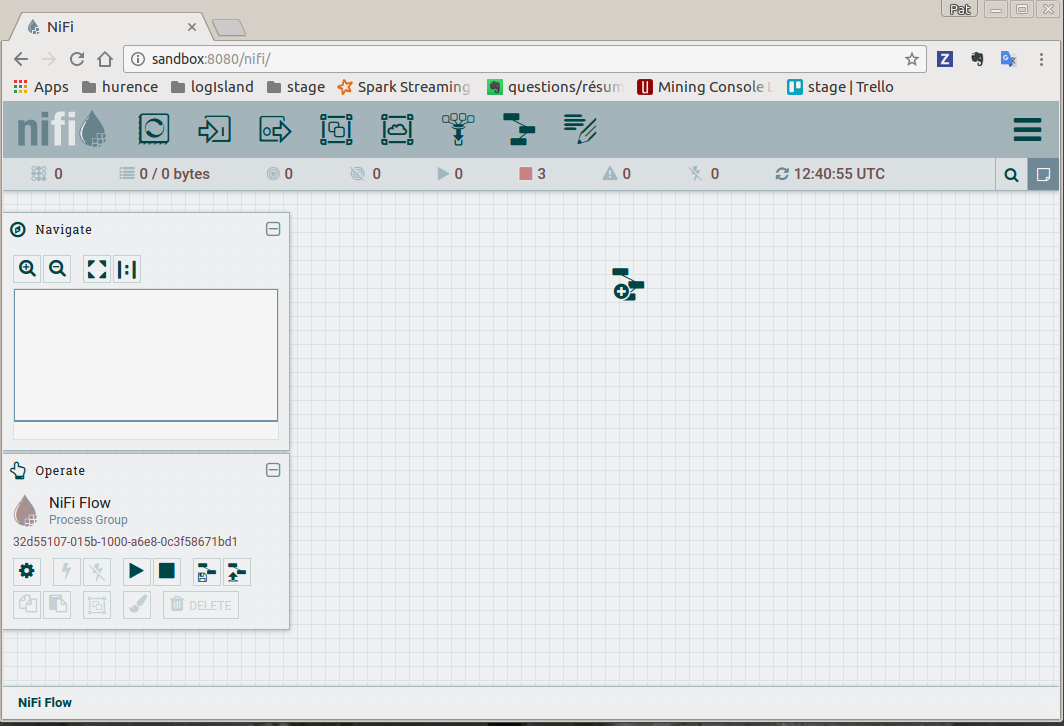
Use this template to create the nifi flow
Drag the nifi toolbar template icon in the nifi work area and choose “nifi_netflow” template, the press “ADD” button
You finally have the following nifi flow
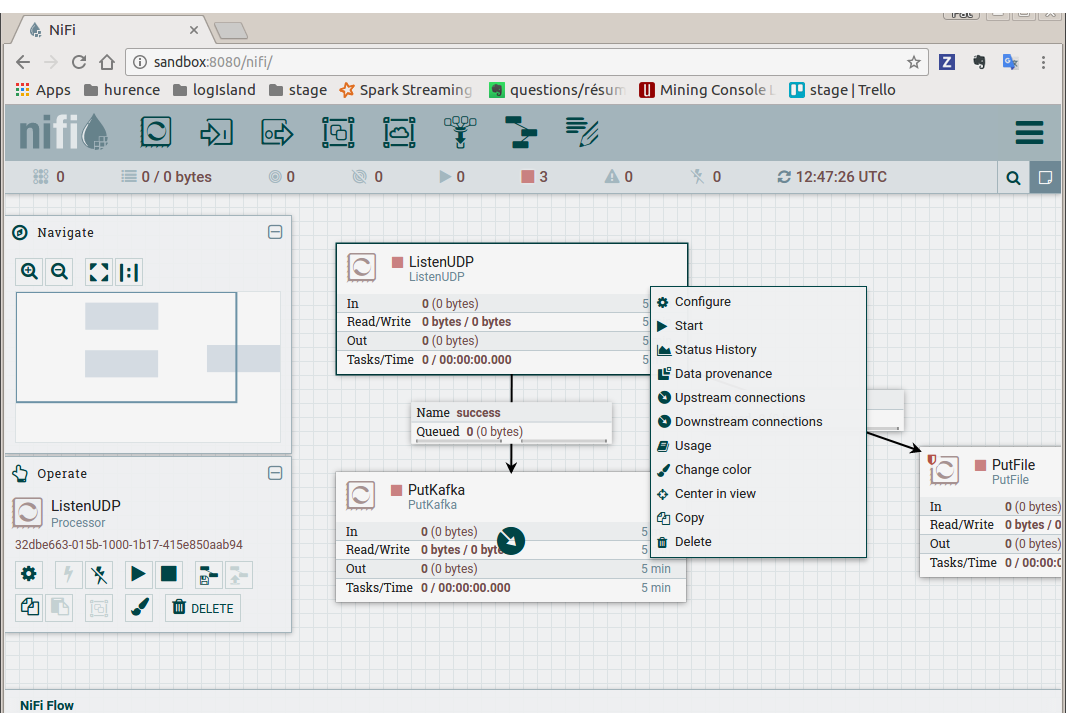
- start nifi processors
Select listenUDP processor of nifi flow, right click on it and press “Start”. Do the same for putKafka processor.
Note
the PutFile processor is only for debugging purpose. It dumps netflow records to /tmp/netflow directory (that should be previously created). So you normally don’t have to start it for that demo.
3. Parse Netflow records
For this tutorial we will handle netflow binary events, generate corresponding logisland records and store them to Elastiscearch
Connect a shell to your logisland container to launch the following streaming jobs.
docker exec -ti logisland bash
cd $LOGISLAND_HOME
bin/logisland.sh --conf conf/index-netflow-events.yml
Setup Spark/Kafka streaming engine
An Engine is needed to handle the stream processing. This conf/index-netflow-events.yml configuration file defines a stream processing job setup.
The first section configures the Spark engine (we will use a KafkaStreamProcessingEngine) as well as an Elasticsearch service that will be used later in the BulkAddElasticsearch processor.
engine:
 component: com.hurence.logisland.engine.spark.KafkaStreamProcessingEngine
 type: engine
 documentation: Index Netflow events with LogIsland
 configuration:
   spark.app.name: IndexNetFlowEventsDemo
   spark.master: local[4]
   spark.driver.memory: 1G
   spark.driver.cores: 1
   spark.executor.memory: 2G
   spark.executor.instances: 4
   spark.executor.cores: 2
   spark.yarn.queue: default
   spark.yarn.maxAppAttempts: 4
   spark.yarn.am.attemptFailuresValidityInterval: 1h
   spark.yarn.max.executor.failures: 20
   spark.yarn.executor.failuresValidityInterval: 1h
   spark.task.maxFailures: 8
   spark.serializer: org.apache.spark.serializer.KryoSerializer
   spark.streaming.batchDuration: 4000
   spark.streaming.backpressure.enabled: false
   spark.streaming.unpersist: false
   spark.streaming.blockInterval: 500
   spark.streaming.kafka.maxRatePerPartition: 3000
   spark.streaming.timeout: -1
   spark.streaming.unpersist: false
   spark.streaming.kafka.maxRetries: 3
   spark.streaming.ui.retainedBatches: 200
   spark.streaming.receiver.writeAheadLog.enable: false
   spark.ui.port: 4050

 controllerServiceConfigurations:

   - controllerService: elasticsearch_service
     component: com.hurence.logisland.service.elasticsearch.Elasticsearch_2_4_0_ClientService
     type: service
     documentation: elasticsearch 2.4.0 service implementation
     configuration:
       hosts: sandbox:9300
       cluster.name: elasticsearch
       batch.size: 20000

 streamConfigurations:
Stream 1 : parse incoming Netflow (Binary format) lines
Inside this engine you will run a Kafka stream of processing, so we setup input/output topics and Kafka/Zookeeper hosts.
Here the stream will read all the logs sent in logisland_raw topic and push the processing output into logisland_events topic.
We can define some serializers to marshall all records from and to a topic.
# Parsing
- stream: parsing_stream
  component: com.hurence.logisland.stream.spark.KafkaRecordStreamParallelProcessing
  type: stream
  documentation: A processor chain that transforms Netflow events into Logisland records
  configuration:
    kafka.input.topics: netflow
    kafka.output.topics: logisland_events
    kafka.error.topics: logisland_errors
    kafka.input.topics.serializer: none
    kafka.output.topics.serializer: com.hurence.logisland.serializer.KryoSerializer
    kafka.error.topics.serializer: com.hurence.logisland.serializer.JsonSerializer
    kafka.metadata.broker.list: sandbox:9092
    kafka.zookeeper.quorum: sandbox:2181
    kafka.topic.autoCreate: true
    kafka.topic.default.partitions: 2
    kafka.topic.default.replicationFactor: 2
  processorConfigurations:
Within this stream there is a single processor in the processor chain: the Netflow processor. It takes an incoming Netflow event/notice binary record, parses it and computes a Logisland Record as a sequence of fields that were contained in the binary record.
# Transform Netflow events into Logisland records
     - processor: Netflow adaptor
       component: com.hurence.logisland.processor.netflow.ParseNetflowEvent
       type: parser
       documentation: A processor that transforms Netflow events into LogIsland events
       configuration:
         debug: false
         enrich.record: false
This stream will process log entries as soon as they will be queued into logisland_raw Kafka topics, each log will be parsed as an event which will be pushed back to Kafka in the logisland_events topic.
Stream 2: Index the processed records into Elasticsearch
The second Kafka stream will handle Records pushed into the logisland_events topic to index them into ElasticSearch. So there is no need to define an output topic:
# Indexing
- stream: indexing_stream
  component: com.hurence.logisland.stream.spark.KafkaRecordStreamParallelProcessing
  type: processor
  documentation: A processor chain that pushes netflow events to ES
  configuration:
    kafka.input.topics: logisland_events
    kafka.output.topics: none
    kafka.error.topics: logisland_errors
    kafka.input.topics.serializer: com.hurence.logisland.serializer.KryoSerializer
    kafka.output.topics.serializer: none
    kafka.error.topics.serializer: com.hurence.logisland.serializer.JsonSerializer
    kafka.metadata.broker.list: sandbox:9092
    kafka.zookeeper.quorum: sandbox:2181
    kafka.topic.autoCreate: true
    kafka.topic.default.partitions: 2
    kafka.topic.default.replicationFactor: 1
  processorConfigurations:
The only processor in the processor chain of this stream is the BulkAddElasticsearch processor.
# Bulk add into ElasticSearch
- processor: ES Publisher
  component: com.hurence.logisland.processor.elasticsearch.BulkAddElasticsearch
  type: processor
  documentation: A processor that pushes Netflow events into ES
  configuration:
    elasticsearch.client.service: elasticsearch_service
    default.index: netflow
    default.type: events
    timebased.index: today
    es.index.field: search_index
    es.type.field: record_type
The default.index: netflow configuration parameter tells the processor to index events into
an index starting with the netflow string.
The timebased.index: today configuration parameter tells the processor to use the current date after the index prefix. Thus the index name is of the form /netflow.2017.03.30.
Finally, the es.type.field: record_type configuration parameter tells the processor to use the
record field record_type of the incoming record to determine the ElasticSearch type to use within the index.
4. Inject Netflow events into the system
Generate Netflow events to port 2055 of localhost
Now that we have our nifi flow listening on port 2055 from Netflow (V5) traffic and push them to kafka, we have to generate netflow traffic. For the purpose of this tutorial, as already mentioned, we will install and use a netflow traffic generator (but you can use whatever other way to generate Netflow V5 traffic to port 2055)
docker exec -ti logisland bash
cd /tmp
wget https://github.com/pazdera/NetFlow-Exporter-Simulator/archive/master.zip
unzip master.zip
cd NetFlow-Exporter-Simulator-master/
make
./nfgen   #this command will generate netflow V5 traffic and send it to local port 2055.
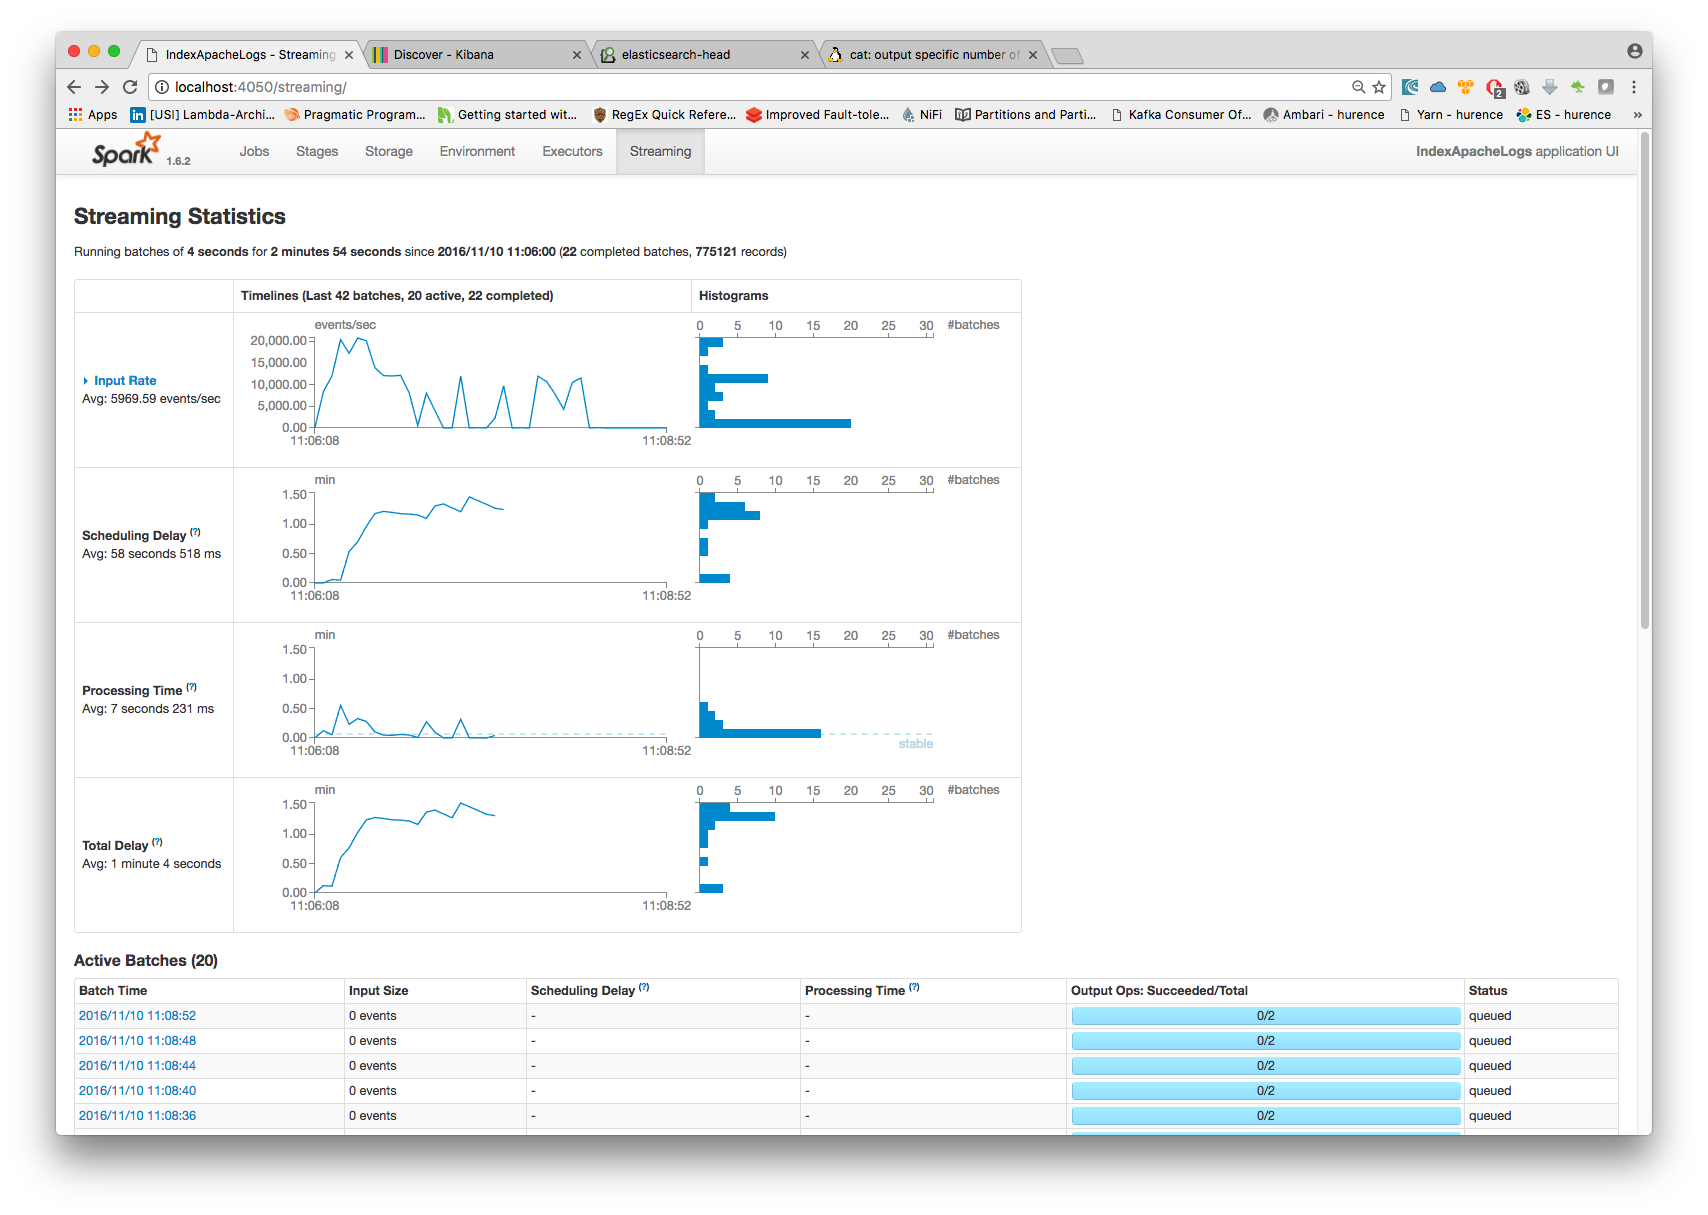
5. Monitor your spark jobs and Kafka topics
Now go to http://sandbox:4050/streaming/ to see how fast Spark can process your data
6. Use Kibana to inspect events
Inspect Netflow events under Discover tab
Open your browser and go to http://sandbox:5601/
Configure a new index pattern with netflow.* as the pattern name and @timestamp as the time value field.
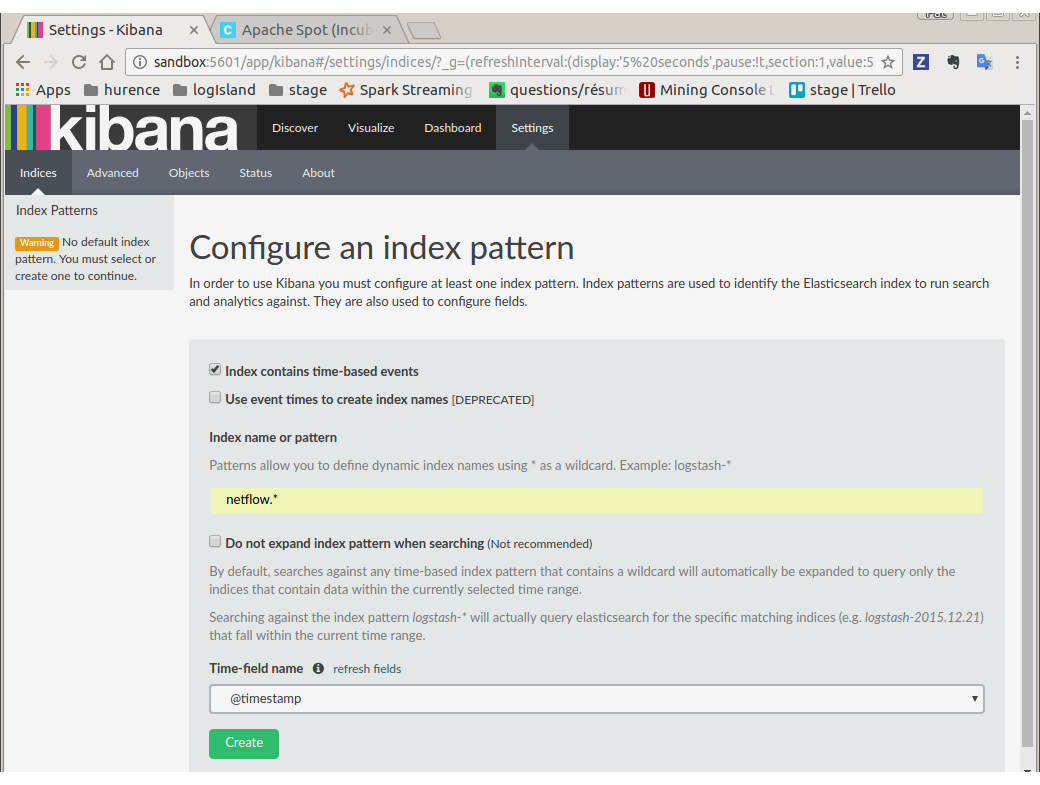
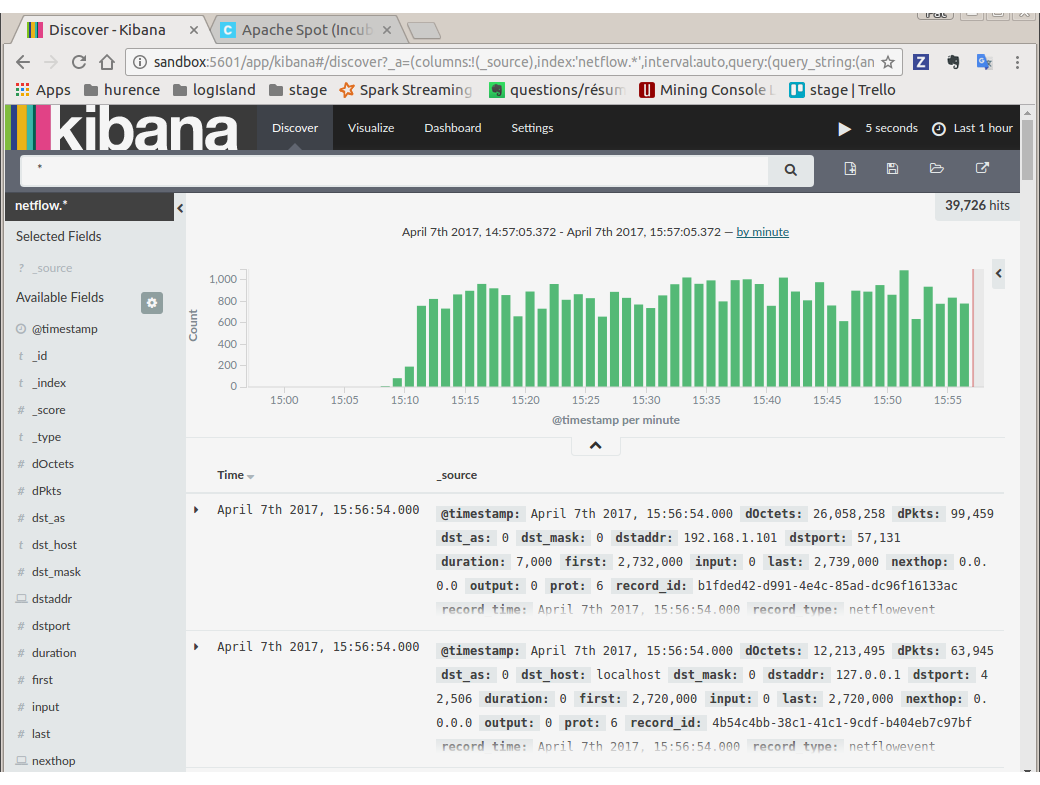
Then browse “Discover” tab, you should be able to explore your Netflow events.
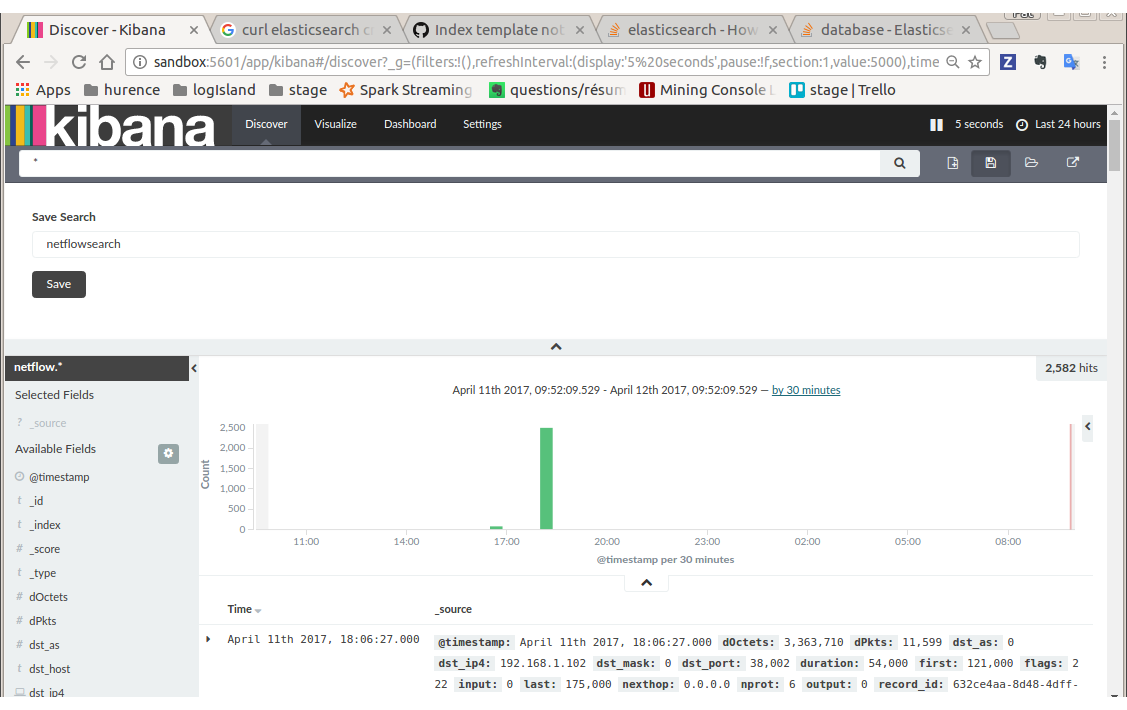
You have now to save your search by clicking the save icon. Save this search as “netflowsearch”
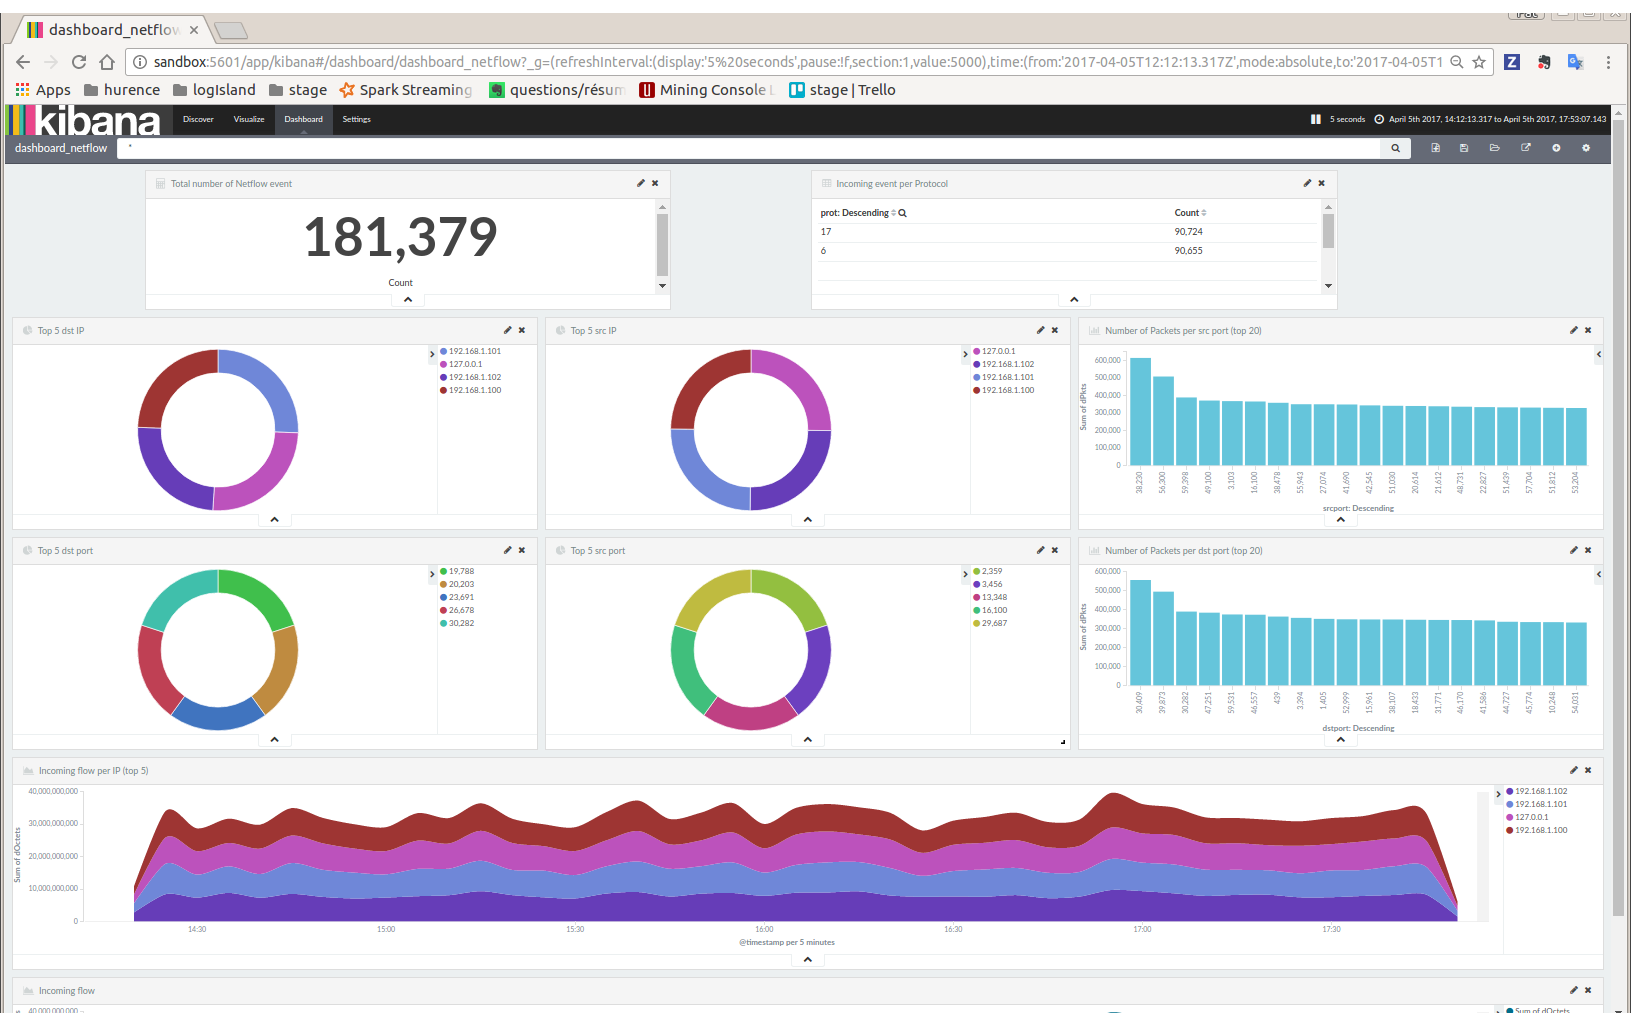
Display network information in kibana dashboard
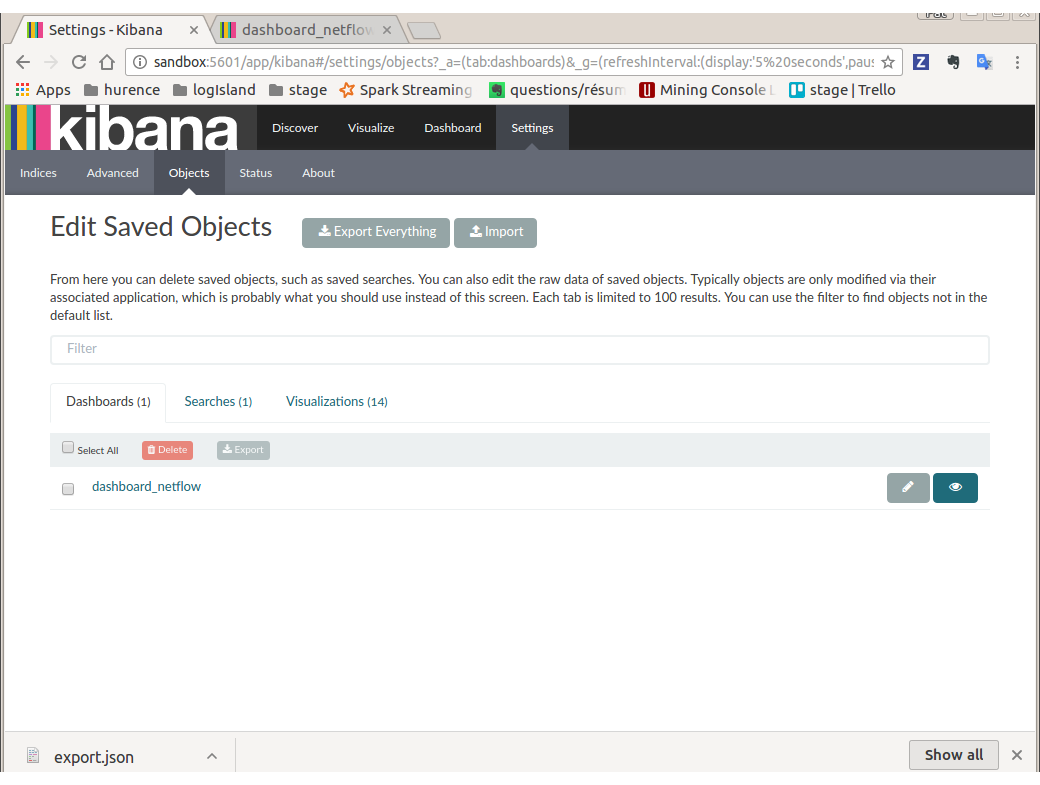
First, you need to import the predefined Kibana dashboard (download this file first) under Settings tab, Objetcs subtab.
Select Import and load previously saved netflow_dashboard.json dashboard (it also contains required Kibana visualizations)
Then visit Dashboard tab, and open dashboard_netflow dashboard by clicking on Load Saved Dashboard. You should be able to visualize information about the generated traffic (choose the right time window, corresponding to the time of your traffic, in the right upper corner of kibana page)