IIoT with OPC and Logisland
In this tutorial we’ll show you how to ingest IIoT data from an OPC-UA server and process it with Logisland, storing everything into an elasticsearch database.
In particular, we’ll use the Prosys OPC-UA simulation server you can download for free here
Note
You will need to have a logisland Docker environment. Please follow the prerequisites section for more information.
Please also remember to always turn on the simulation server before running the logisland job.
1.Install required components
For this tutorial please make sure to already have installed elasticsearch and OPC modules. If not you can just do it through the componentes.sh command line:
bin/components.sh -i com.hurence.logisland:logisland-processor-elasticsearch:1.1.2

bin/components.sh -i com.hurence.logisland:logisland-service-elasticsearch_5_4_0-client:1.1.2

bin/components.sh -i com.hurence.logisland:logisland-connector-opc:1.1.2
2. Logisland job setup
The logisland job for this tutorial is already packaged in the tar.gz assembly and you can find it here for ElasticSearch :
docker exec -i -t logisland vim conf/opc-iiot.yml
We will start by explaining each part of the config file.
The first section configures the Spark engine (we will use a KafkaStreamProcessingEngine) to run in local mode with 1 cpu cores and 512M of RAM.
engine:
  component: com.hurence.logisland.engine.spark.KafkaStreamProcessingEngine
  type: engine
  documentation: Index some OPC-UA tagw with Logisland
  configuration:
  spark.app.name: OpcUaLogisland
  spark.master: local[2]
  spark.driver.memory: 512M
  spark.driver.cores: 1
  spark.executor.memory: 512M
  spark.executor.instances: 4
  spark.executor.cores: 1
  spark.yarn.queue: default
  spark.yarn.maxAppAttempts: 4
  spark.yarn.am.attemptFailuresValidityInterval: 1h
  spark.yarn.max.executor.failures: 20
  spark.yarn.executor.failuresValidityInterval: 1h
  spark.task.maxFailures: 8
  spark.serializer: org.apache.spark.serializer.KryoSerializer
  spark.streaming.batchDuration: 3000
  spark.streaming.backpressure.enabled: false
  spark.streaming.blockInterval: 500
  spark.streaming.kafka.maxRatePerPartition: 10000
  spark.streaming.timeout: -1
  spark.streaming.unpersist: false
  spark.streaming.kafka.maxRetries: 3
  spark.streaming.ui.retainedBatches: 200
  spark.streaming.receiver.writeAheadLog.enable: false
  spark.ui.port: 4040
The controllerServiceConfigurations part is here to define all services that be shared by processors within the whole job.
Here we have the OPC-UA source with all the connection parameters.
- controllerService: kc_source_service
  component: com.hurence.logisland.stream.spark.provider.KafkaConnectStructuredSourceProviderService
   documentation: Kafka connect OPC-UA source service
   type: service
   configuration:
     kc.connector.class: com.hurence.logisland.connect.opc.ua.OpcUaSourceConnector
     kc.data.value.converter: com.hurence.logisland.connect.converter.LogIslandRecordConverter
     kc.data.value.converter.properties: |
       record.serializer=com.hurence.logisland.serializer.KryoSerializer
     kc.data.key.converter.properties: |
       schemas.enable=false
     kc.data.key.converter: org.apache.kafka.connect.storage.StringConverter
     kc.worker.tasks.max: 1
     kc.connector.offset.backing.store: memory
     kc.connector.properties: |
       session.publicationRate=PT1S
       connection.socketTimeoutMillis=10000
       server.uri=opc.tcp://localhost:53530/OPCUA/SimulationServer
       tags.id=ns=5;s=Sawtooth1
       tags.sampling.rate=PT0.5S
       tags.stream.mode=SUBSCRIBE
In particular, we have
- A tag to be read: “ns=5;s=Sawtooth1”
- The tag will be subscribed and sampled each 0.5s
- The data will be published by the opc server each second (session.publicationRate)
- Please use your own opc server uri, in our case opc.tcp://localhost:53530/OPCUA/SimulationServer
Full connector documentation is on javadoc of class com.hurence.logisland.connect.opc.ua.OpcUaSourceConnector
Then we also define her Elasticsearch service that will be used later in the BulkAddElasticsearch processor.
- controllerService: elasticsearch_service
  component: com.hurence.logisland.service.elasticsearch.Elasticsearch_5_4_0_ClientService
  type: service
  documentation: elasticsearch service
  configuration:
    hosts: ${ES_HOSTS}
    cluster.name: ${ES_CLUSTER_NAME}
    batch.size: 5000
Inside this engine you will run a spark structured stream, taking records from the previously defined source and letting data flow through the processing pipeline till the console output.
- stream: ingest_stream
     component: com.hurence.logisland.stream.spark.structured.StructuredStream
     configuration:
       read.topics: /a/in
       read.topics.serializer: com.hurence.logisland.serializer.KryoSerializer
       read.topics.key.serializer: com.hurence.logisland.serializer.StringSerializer
       read.stream.service.provider: kc_source_service
       write.topics: /a/out
       write.topics.serializer: com.hurence.logisland.serializer.JsonSerializer
       write.topics.key.serializer: com.hurence.logisland.serializer.StringSerializer
       write.stream.service.provider: console_service
And now it’s time to describe the parsing pipeline.
First, we need to extract the record thanks to a FlatMap processor
- processor: flatten
  component: com.hurence.logisland.processor.FlatMap
  type: processor
  documentation: "extract from root record"
  configuration:
    keep.root.record: false
    copy.root.record.fields: true
Now that the record is well-formed, we want to set the record time to be the same of the one given by the source (and stored on the field tag_sampled_timestamp).
For this, we use a NormalizeFields processor.
- processor: rename_fields
  component: com.hurence.logisland.processor.NormalizeFields
  type: processor
  documentation: "set record time to tag server generation time"
  configuration:
    conflict.resolution.policy: overwrite_existing
    record_time: tag_sampled_timestamp
Then, the last processor will index our records into elasticsearch
# add to elasticsearch
- processor: es_publisher
  component: com.hurence.logisland.processor.elasticsearch.BulkAddElasticsearch
  type: processor
  documentation: a processor that trace the processed events
  configuration:
    elasticsearch.client.service: elasticsearch_service
    default.index: logisland
    default.type: event
    timebased.index: yesterday
    es.index.field: search_index
    es.type.field: record_type
3. Launch the script
Just ensure the Prosys OPC-UA server is up and running and that on the Simulation tab the simulation is ticked.
Then you can use the docker-compose file docker-compose-opc-iiot.yml available in the tar gz assembly in conf directory.
Note
If your simulation server is hosted on local and the hostname is different from ‘localhost’. For example if your server uri is ‘opc.tcp://${hostname}:53530/OPCUA/SimulationServer’. You can add it to logisland container add a extra_hosts properties to logisland container in docker-compose file so that it is accessible from the container.
logisland:
  network_mode: host
  image: hurence/logisland:1.1.2
  command: tail -f bin/logisland.sh
  environment:
    ZK_QUORUM: localhost:2181
    ES_HOSTS: localhost:9300
    ES_CLUSTER_NAME: es-logisland
  extra_hosts:
    - "${hostname}:127.0.0.1"
Then you can execute:
docker exec -i -t logisland bin/logisland.sh --conf conf/opc-iiot.yml
Note
Be sure to have added your server uri in conf/opc-iiot.yml file.
4. Inspect the records
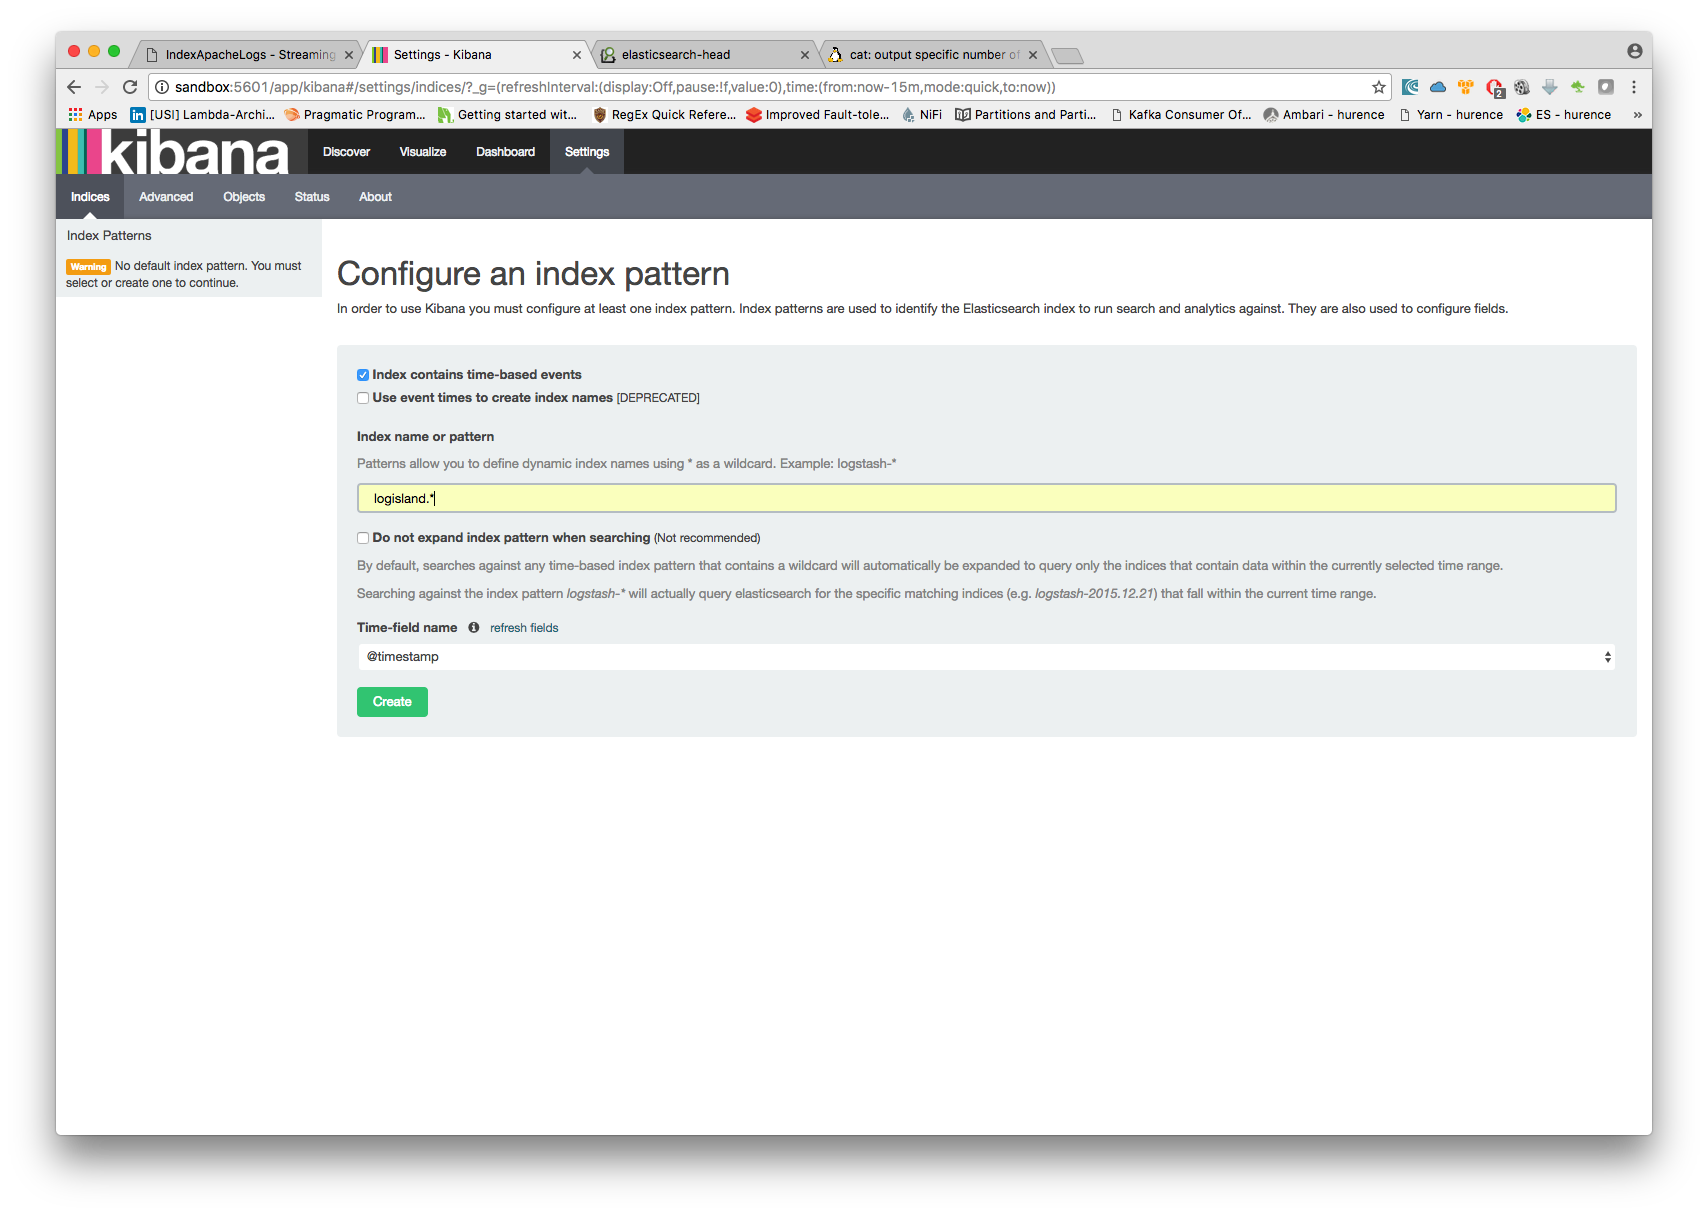
With ElasticSearch, you can use Kibana.
Open up your browser and go to http://localhost:5601/ and you should be able to explore your apache logs.
Configure a new index pattern with logisland.* as the pattern name and @timestamp as the time value field.
Then if you go to Explore panel for the latest 15’ time window you’ll only see logisland process_metrics events which give you insights about the processing bandwidth of your streams.