Index JMS messages
In the following getting started tutorial, we’ll explain you how to read messages from a JMS topic or queue and index them into an elasticsearch store.
The JMS data will leverage the JMS connector available as part of logisland connect.
Note
Be sure to know of to launch a logisland Docker environment by reading the prerequisites section
For kafka connect related information please follow as well the connectors section.
1. Installing ActiveMQ
In this tutorial we’ll use Apache ActiveMQ.
Once you downloaded the broker package just extract it in a folder and turn on your first broker by running:
bin/activemq start
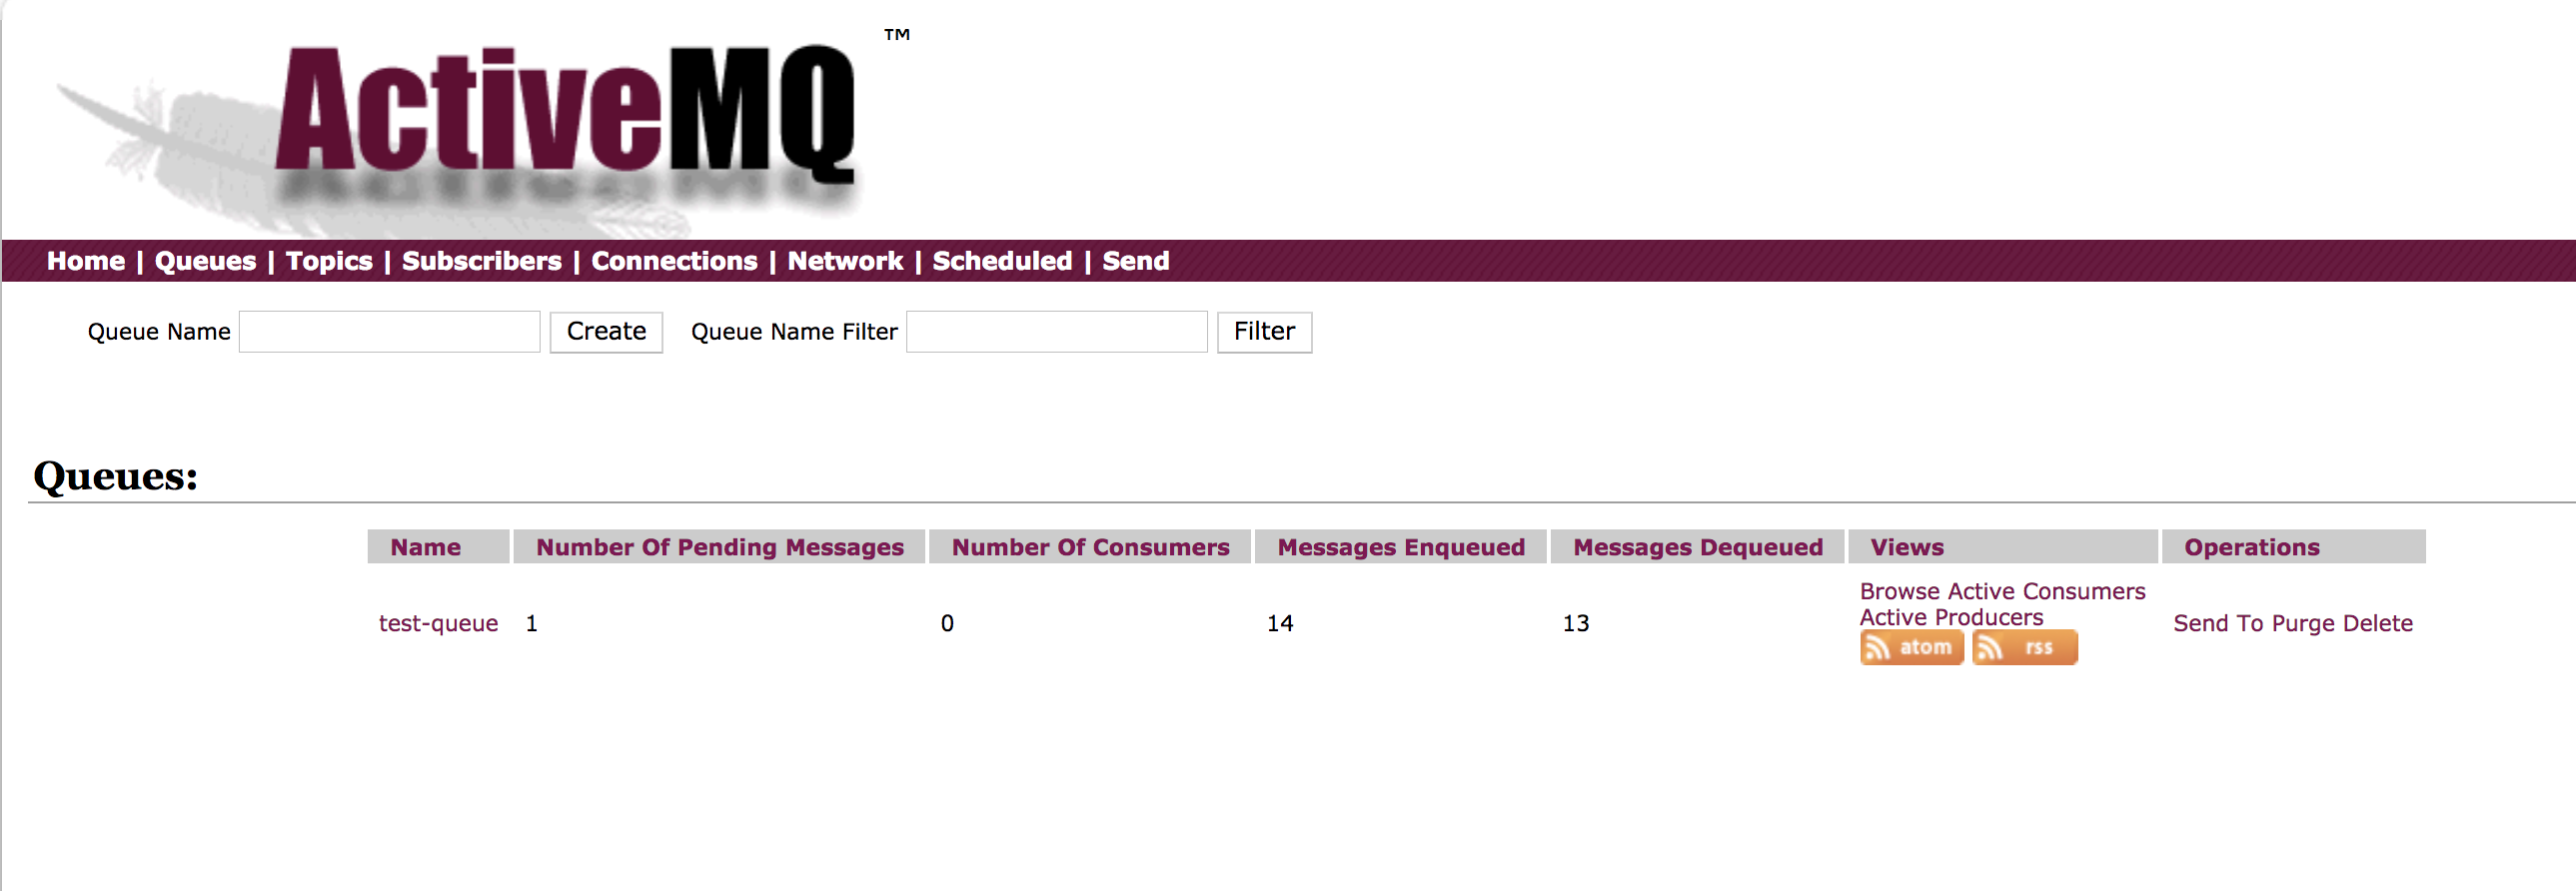
You can verify if your broker is alive by connecting to the ActiveMQ console (login with admin/admin)
We are also going to create a test queue that we’ll use for this tutorial.
To do that, in the just use the ActiveMQ console and in the queue section create a queue named test-queue. You should have your queue created as shown below.
As well, since JMS is actually an API, we have to provide to logisland the JMS connection factory and the client libraries. For this we can just copy the activemq-all-5.15.5.jar into the Logisland lib folder.
For instance, assuming you are running Logisland with the provided docker compose, you can just copy with a command like this:
..code-block:: bash
docker cp ./activemq-all-5.15.5.jar logisland:/usr/local/logisland/lib
You can verify that activemq jar has been successfully copied inside the docker container by running
..code-block:: bash
docker exec logisland ls lib/
2. Logisland job setup
For this tutorial please make sure to already have installed elasticsearch and JMS connector modules.
If not you can just do it through the componentes.sh command line:
bin/components.sh -i com.hurence.logisland:logisland-processor-elasticsearch:1.1.2

bin/components.sh -i com.hurence.logisland:logisland-service-elasticsearch_5_4_0-client:1.1.2

bin/components.sh -i com.datamountaineer:kafka-connect-jms:1.1.2
The interesting part in this tutorial is how to setup the JMS stream.
Let’s first focus on the stream configuration and then on its pipeline in order to extract the data in the right way.
The JMS stream
Here we are going to use a special processor (KafkaConnectStructuredSourceProviderService) to use the kafka connect source as input for the structured stream defined below.
Logisland ships by default a kafka connect JMS source implemented by the class com.datamountaineer.streamreactor.connect.jms.source.JMSSourceConnector.
You can find more information about how to configure a JMS source in the official page of the JMS Connector
Coming back to our example, we would like to read from a queue called test-queue hosted in our local ActiveMQ broker. For this we will connect as usual to its Openwire channel and we’ll use client acknowledgement to be sure to have an exactly once delivery.
The kafka connect controller service configuration will look like this:
- controllerService: kc_source_service
  component: com.hurence.logisland.stream.spark.provider.KafkaConnectStructuredSourceProviderService
  configuration:
    kc.data.value.converter: com.hurence.logisland.connect.converter.LogIslandRecordConverter
    kc.data.value.converter.properties: |
      record.serializer=com.hurence.logisland.serializer.KryoSerializer
    kc.data.key.converter.properties: |
      schemas.enable=false
    kc.data.key.converter: org.apache.kafka.connect.storage.StringConverter
    kc.worker.tasks.max: 1
    kc.connector.class: com.datamountaineer.streamreactor.connect.jms.source.JMSSourceConnector
    kc.connector.offset.backing.store: memory
    kc.connector.properties: |
      connect.jms.url=tcp://sandbox:61616
      connect.jms.initial.context.factory=org.apache.activemq.jndi.ActiveMQInitialContextFactory
      connect.jms.connection.factory=ConnectionFactory
      connect.jms.kcql=INSERT INTO topic SELECT * FROM test-queue WITHTYPE QUEUE
      connect.progress.enabled=true
The pipeline
Within this stream, a we need to extract the data coming from the JMS.
First of all a FlatMap processor takes out the value and key (required when using StructuredStream as source of records)
processorConfigurations:
 - processor: flatten
   component: com.hurence.logisland.processor.FlatMap
   type: processor
   documentation: "Takes out data from record_value"
   configuration:
     keep.root.record: false
Then, since our JMS messages will carry text data, we need to extract this data from the raw message bytes:
- processor: add_fields
  component: com.hurence.logisland.processor.AddFields
  type: processor
  documentation: "Extract the message as a text"
  configuration:
  conflict.resolution.policy: overwrite_existing
  message_text: ${new String(bytes_payload)}
Now we will as well set the record time as the time when the message has been created (and not received). This thanks to a NormalizeFields processor:
- processor: rename_fields
  component: com.hurence.logisland.processor.NormalizeFields
  type: processor
  documentation: "Change the record time according to message_timestamp field"
  configuration:
  conflict.resolution.policy: overwrite_existing
  record_time: message_timestamp
Last but not least, a BulkAddElasticsearch takes care of indexing a Record sending it to elasticsearch.
-  processor: es_publisher
   component: com.hurence.logisland.processor.elasticsearch.BulkAddElasticsearch
   type: processor
   documentation: a processor that indexes processed events in elasticsearch
   configuration:
     elasticsearch.client.service: elasticsearch_service
     default.index: logisland
     default.type: event
     timebased.index: yesterday
     es.index.field: search_index
     es.type.field: record_type
In details, this processor makes use of a Elasticsearch_5_4_0_ClientService controller service to interact with our Elasticsearch 5.X backend
running locally (and started as part of the docker compose configuration we mentioned above).
Here below its configuration:
- controllerService: elasticsearch_service
  component: com.hurence.logisland.service.elasticsearch.Elasticsearch_5_4_0_ClientService
  type: service
  documentation: elasticsearch service
  configuration:
    hosts: sandbox:9300
    cluster.name: es-logisland
    batch.size: 5000
3. Launch the script
Connect a shell to your logisland container to launch the following streaming jobs.
bin/logisland.sh --conf conf/index-jms-messages.yml
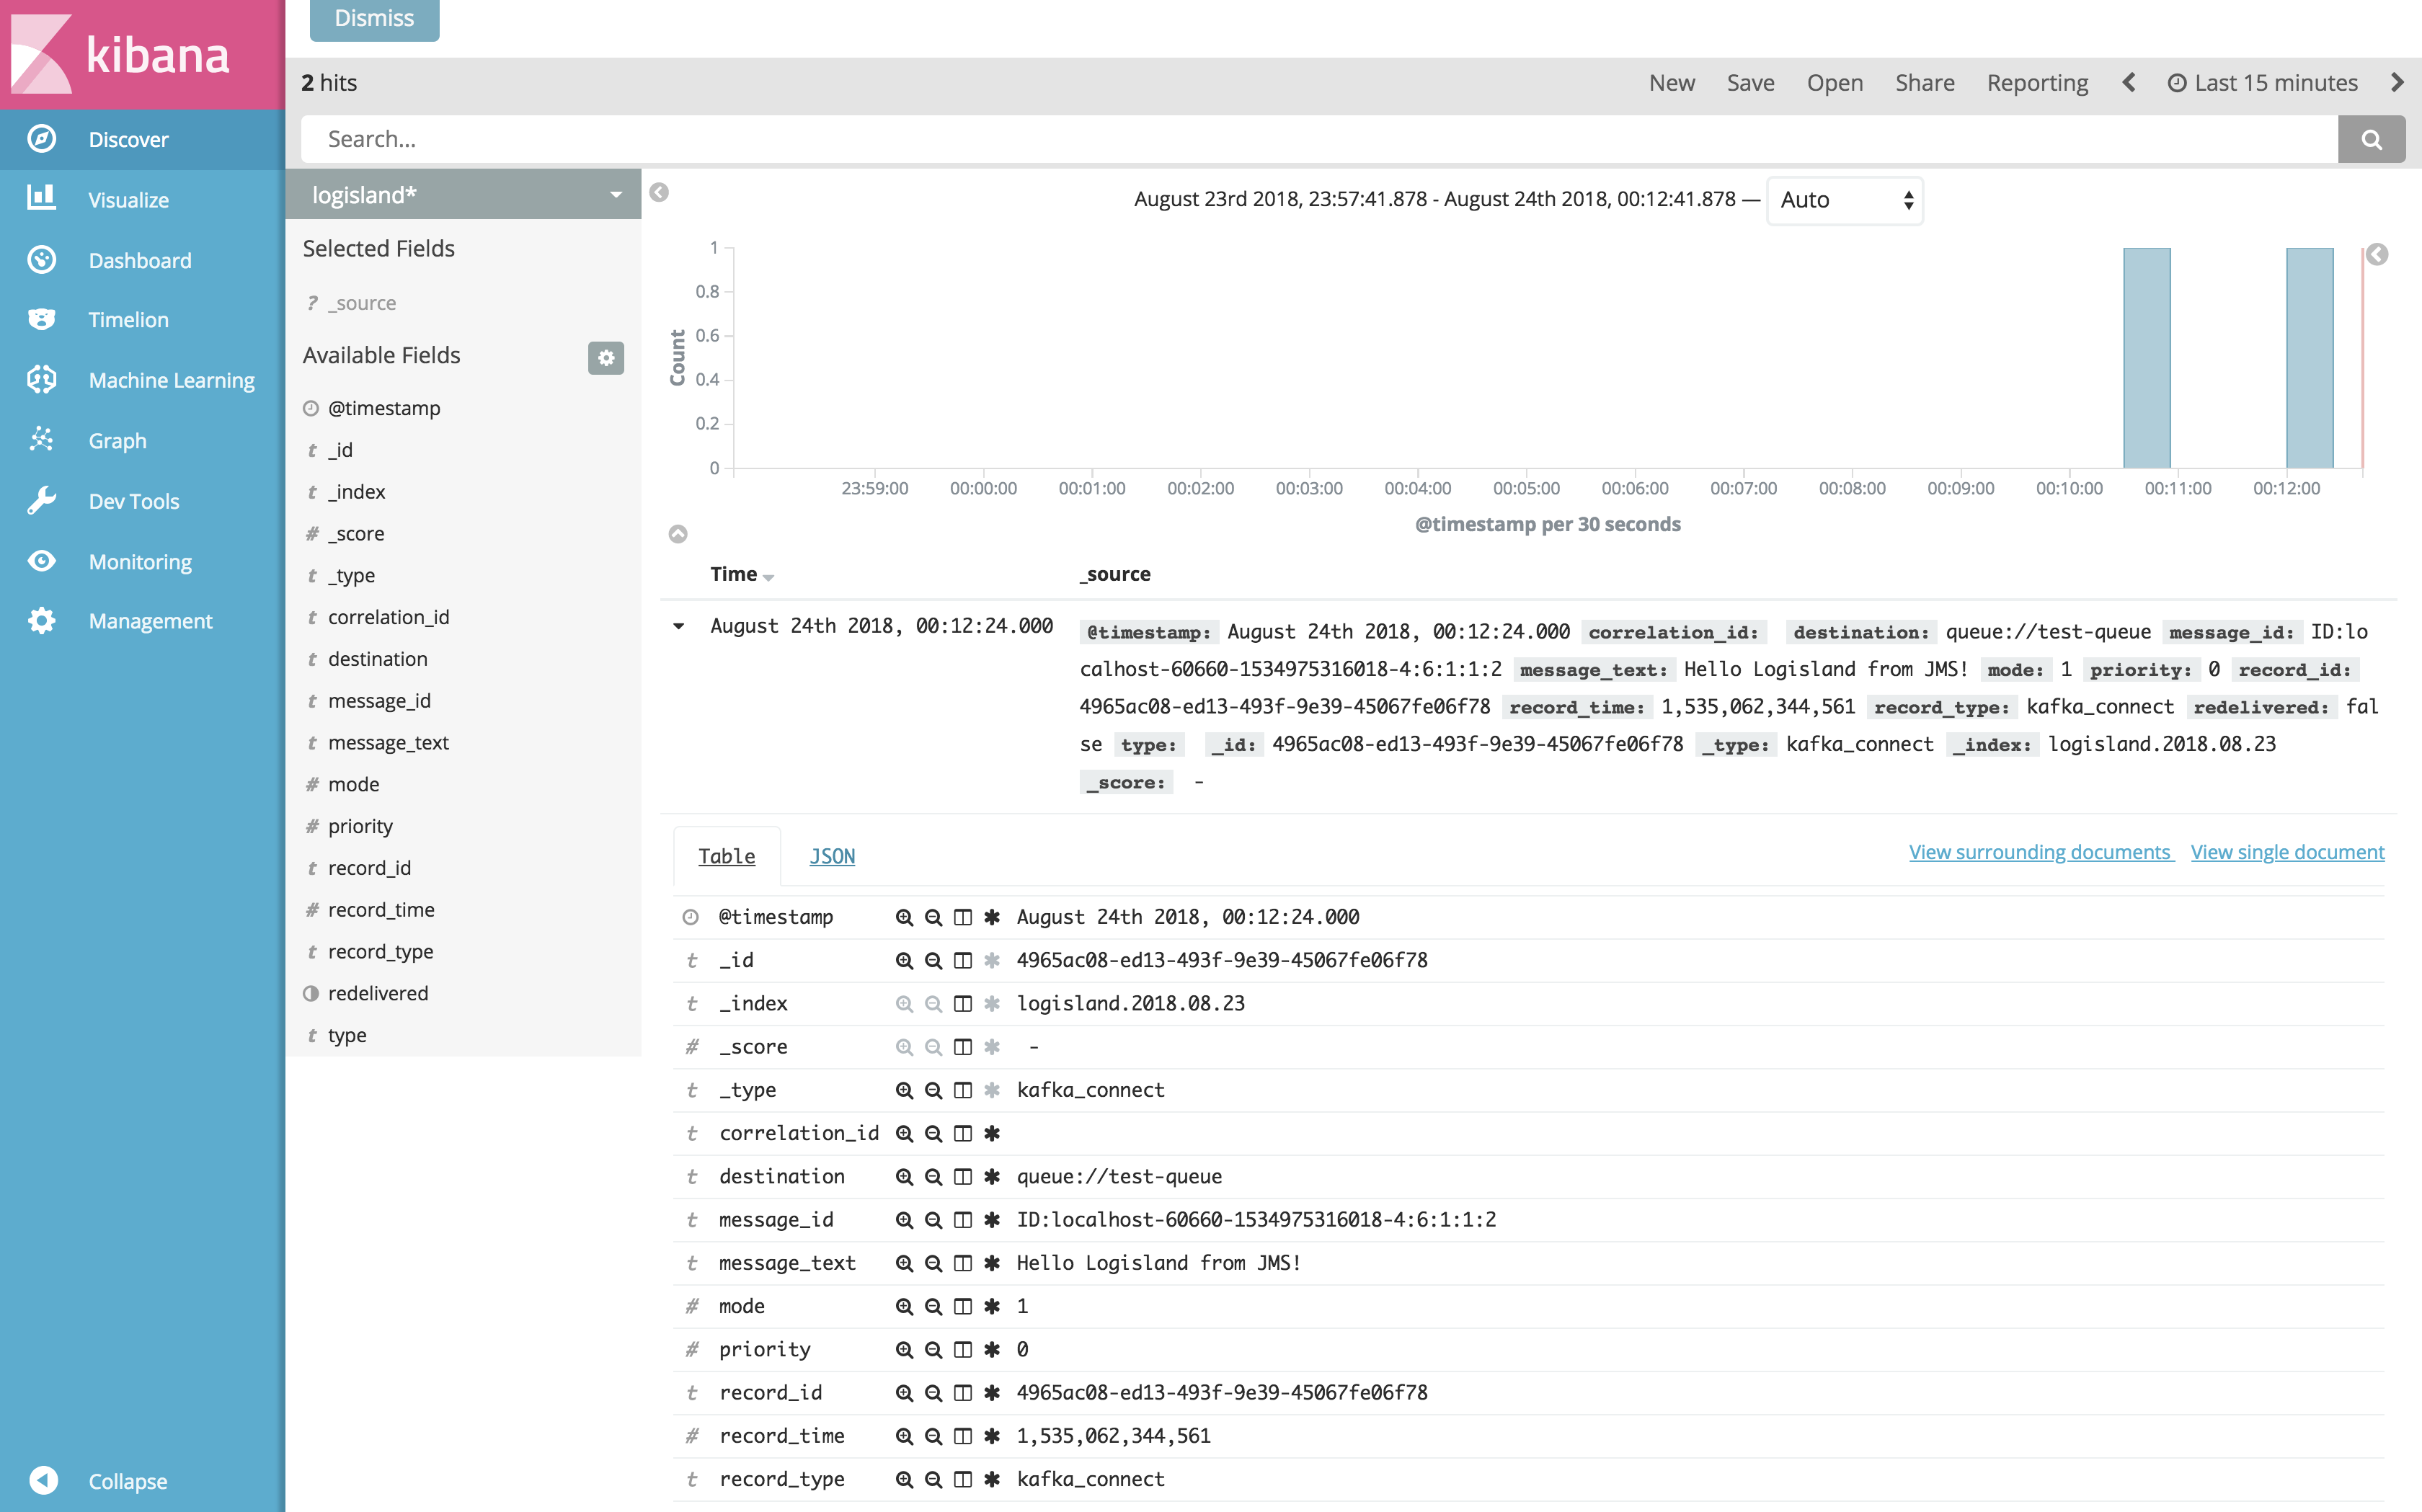
4. Do some insights and visualizations
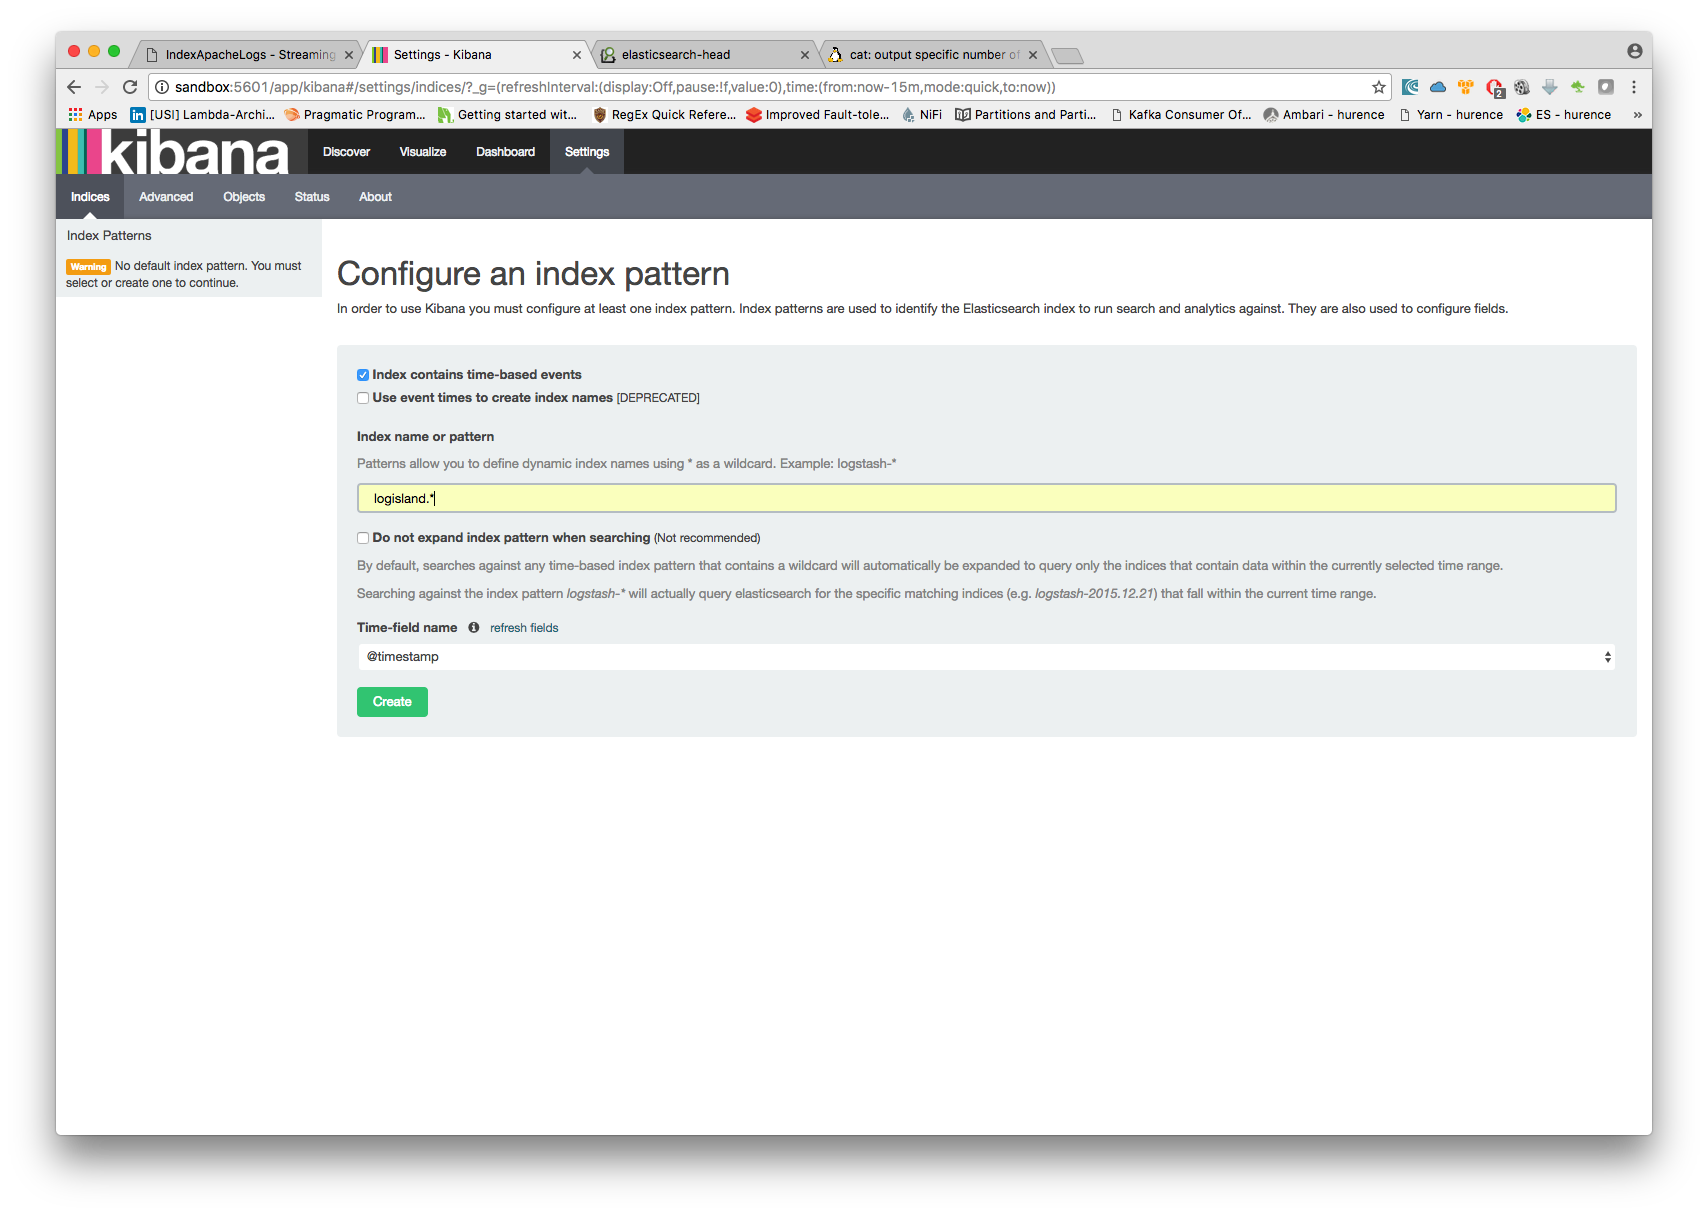
With ElasticSearch, you can use Kibana.
Open up your browser and go to http://sandbox:5601/app/kibana#/ and you should be able to explore the blockchain transactions.
Configure a new index pattern with logisland.* as the pattern name and @timestamp as the time value field.
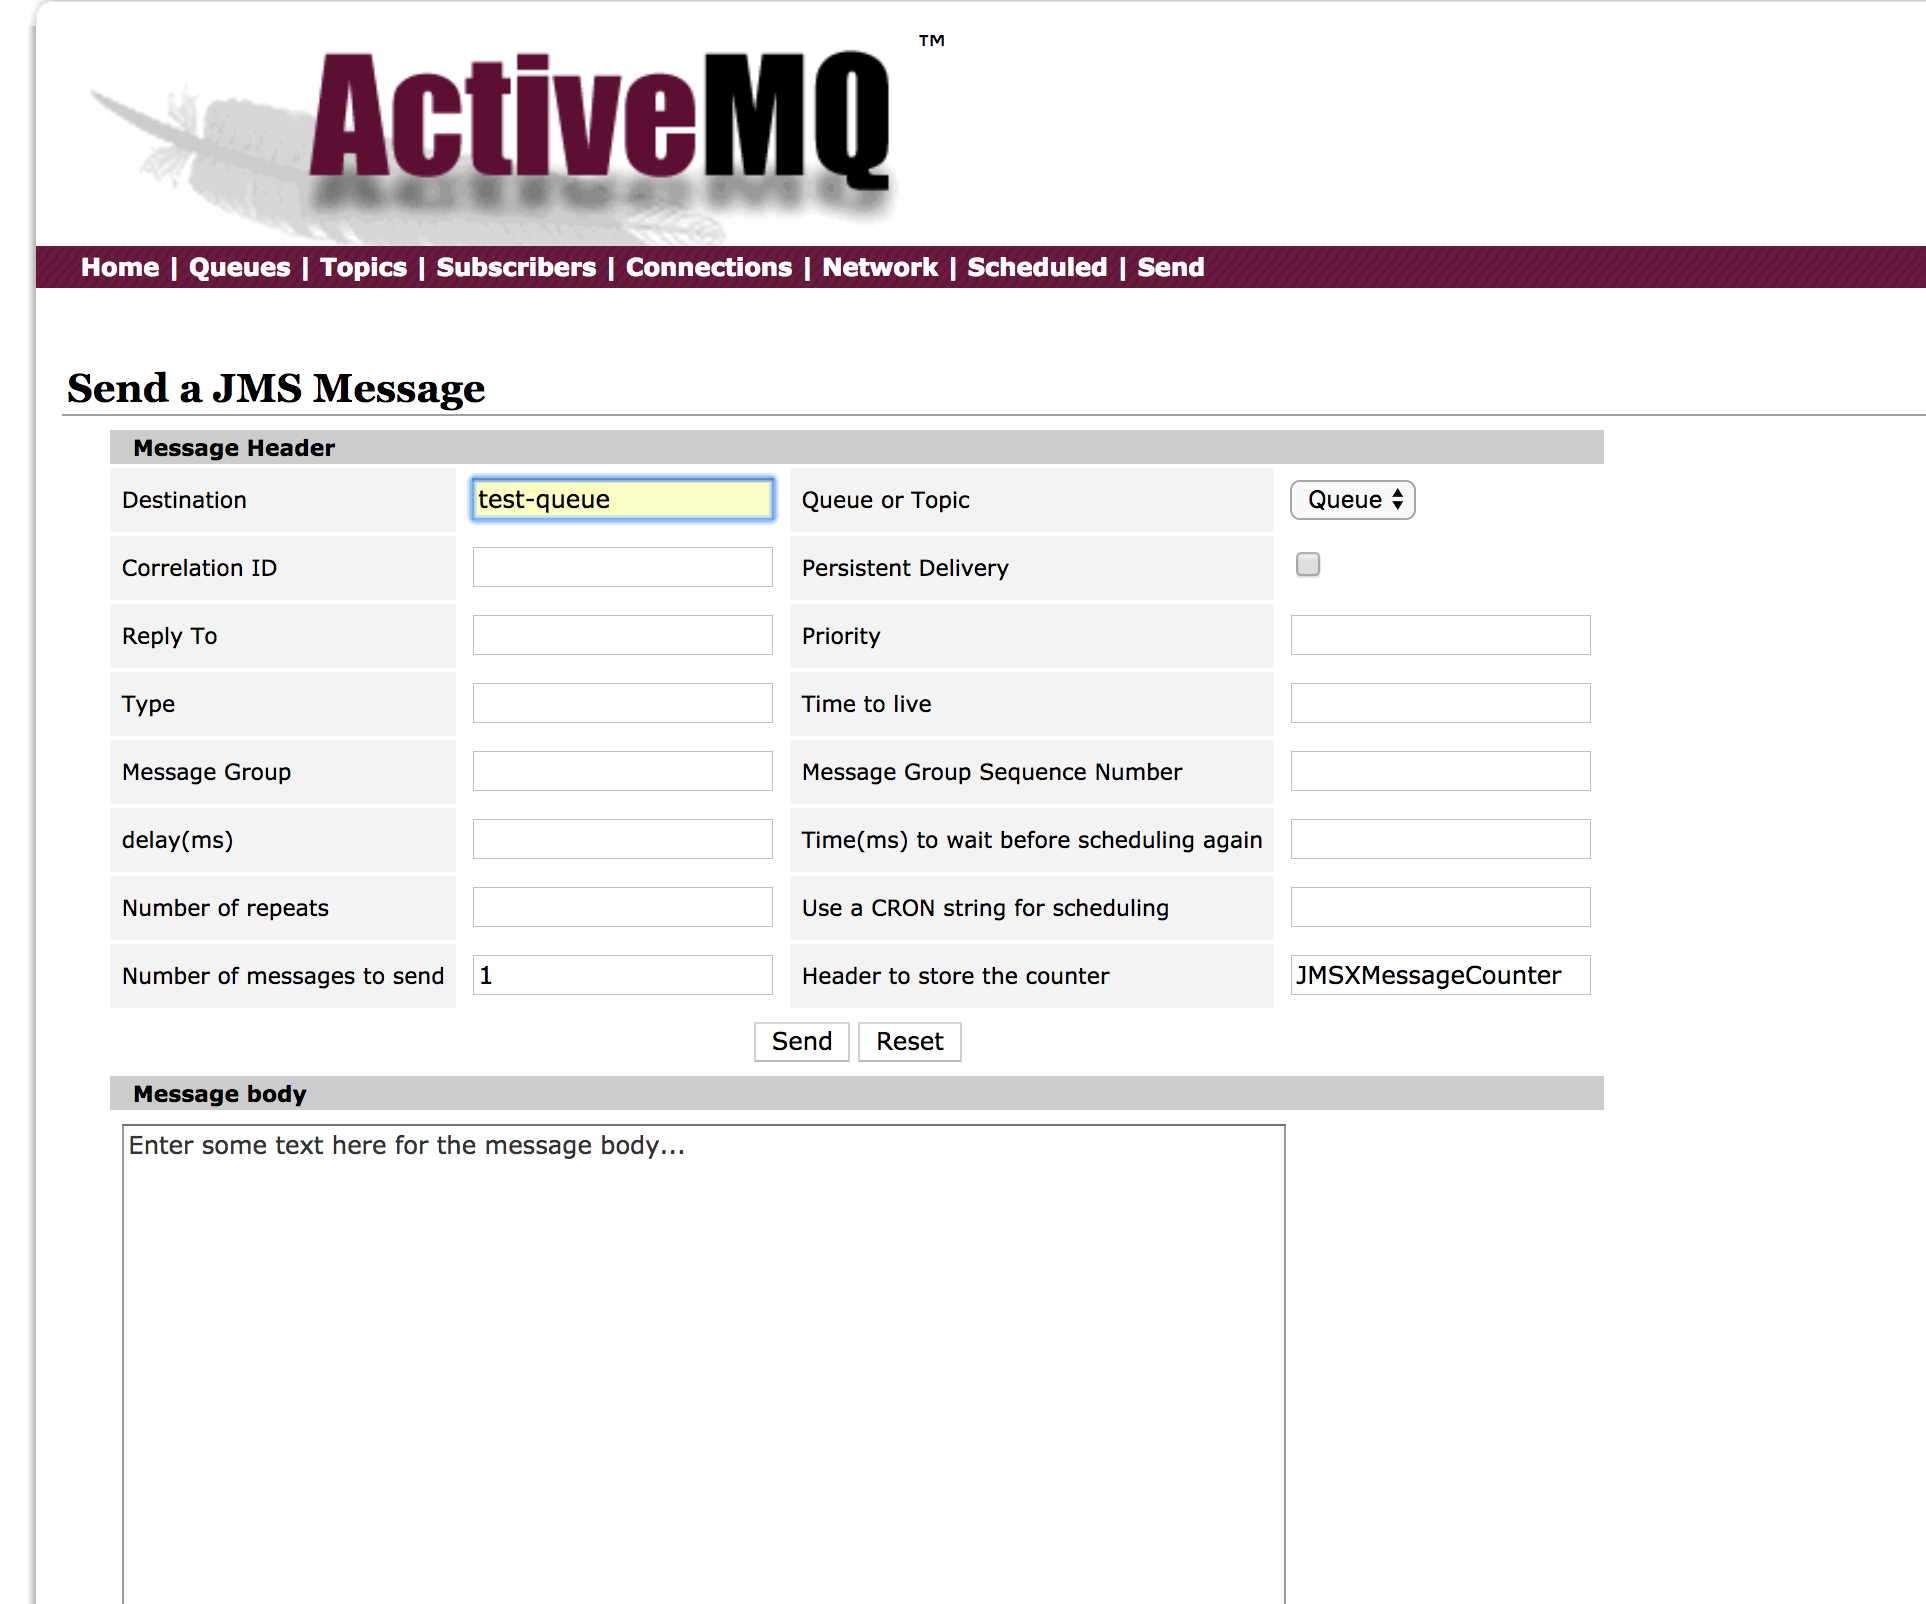
Now just send some message thanks to the ActiveMQ console.
Click on the Send link on the top of the console main page and specify the destination to test-queue and type the message you like. You should have something like this:
Now that the message have been consumed (you can also verify this thanks to the ActiveMQ console) you can come back to kibana and go to Explore panel for the latest 15’ time window you’ll only see logisland process_metrics events which give you insights about the processing bandwidth of your streams.
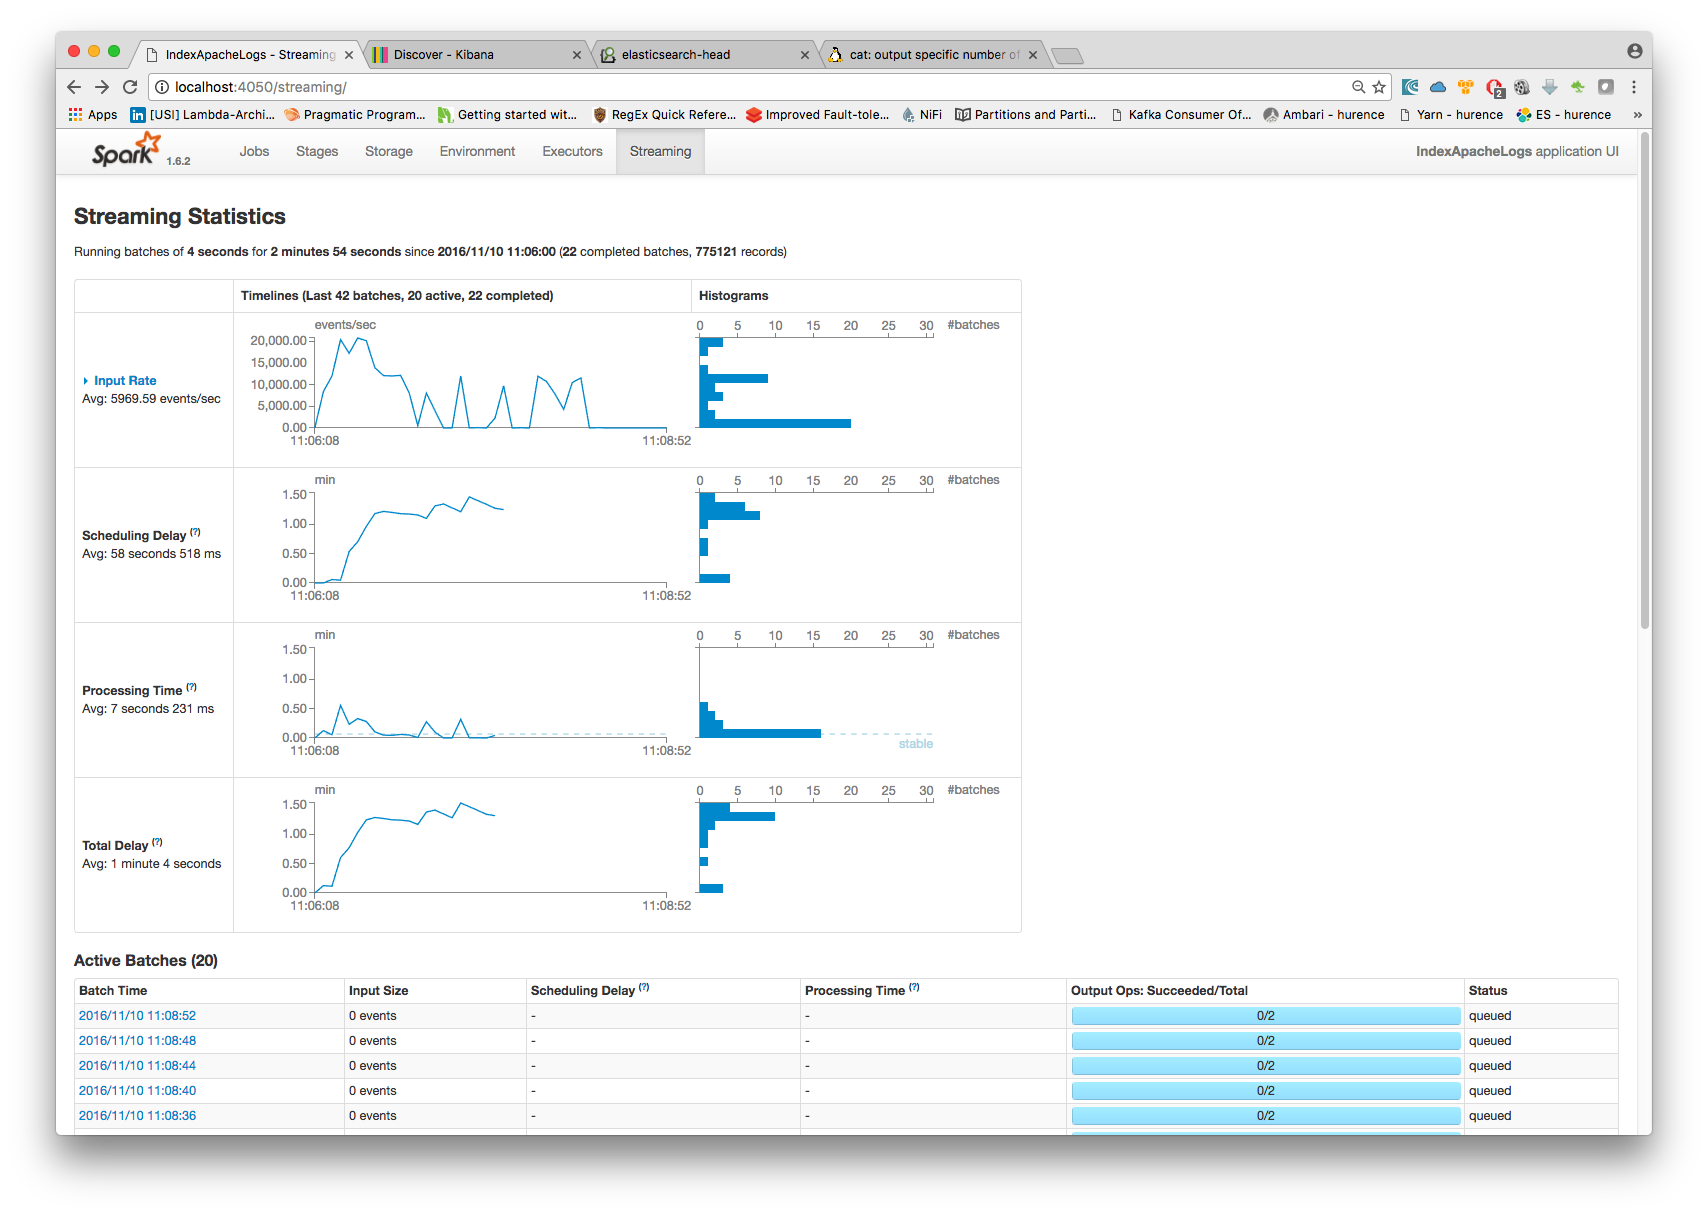
5. Monitor your spark jobs and Kafka topics
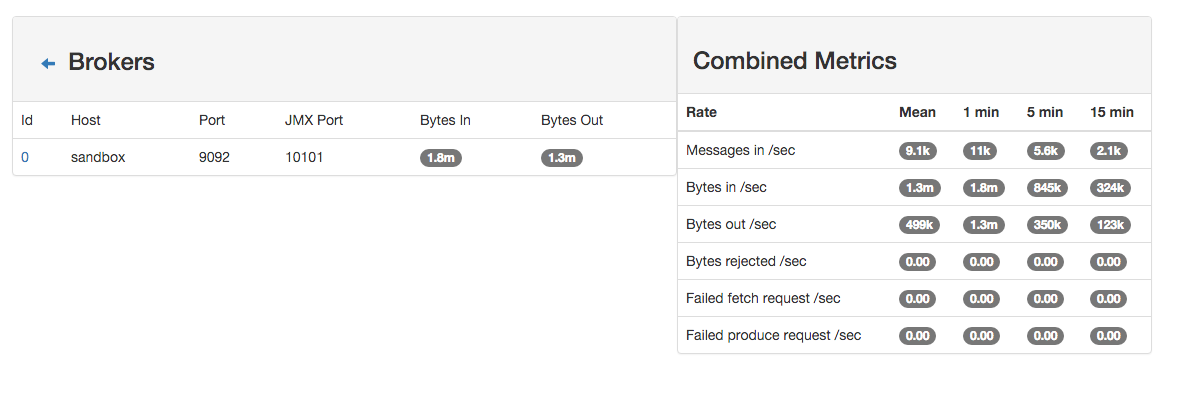
Now go to http://sandbox:4050/streaming/ to see how fast Spark can process your data
Another tool can help you to tweak and monitor your processing http://sandbox:9000/