Event aggregation
In the following tutorial we’ll learn how to generate time window metrics on some http traffic (apache log records) and how to raise custom alerts based on lucene matching query criterion.
We assume that you already know how to parse and ingest Apache logs into logisland. If it’s not the case please refer to the previous Apache logs indexing tutorial. We will first add an SQLAggregator Stream to compute some metrics and then add a MatchQuery Processor.
Note
Be sure to know of to launch a logisland Docker environment by reading the prerequisites section
1.Install required components
For this tutorial please make sure to already have installed elasticsearch modules. If not you can just do it through the componentes.sh command line:
bin/components.sh -i com.hurence.logisland:logisland-processor-elasticsearch:1.1.2

bin/components.sh -i com.hurence.logisland:logisland-service-elasticsearch_5_4_0-client:1.1.2
2. Logisland job setup
The logisland job for this tutorial is already packaged in the tar.gz assembly and you can find it here :
docker exec -i -t logisland vim conf/aggregate-events.yml
We will start by explaining each part of the config file.
Our application will be composed of 4 streams :
The first one converts apache logs to typed records (please note the use of ConvertFieldsType processor)
The second one is the sql stream is a special one one use a KafkaRecordStreamSQLAggregator. This stream defines input/output topics names as well as Serializers, avro schema.
Note
The Avro schema is set for the input topic and must be same as the avro schema of the output topic for the stream that produces the records (please refer to Index Apache logs tutorial
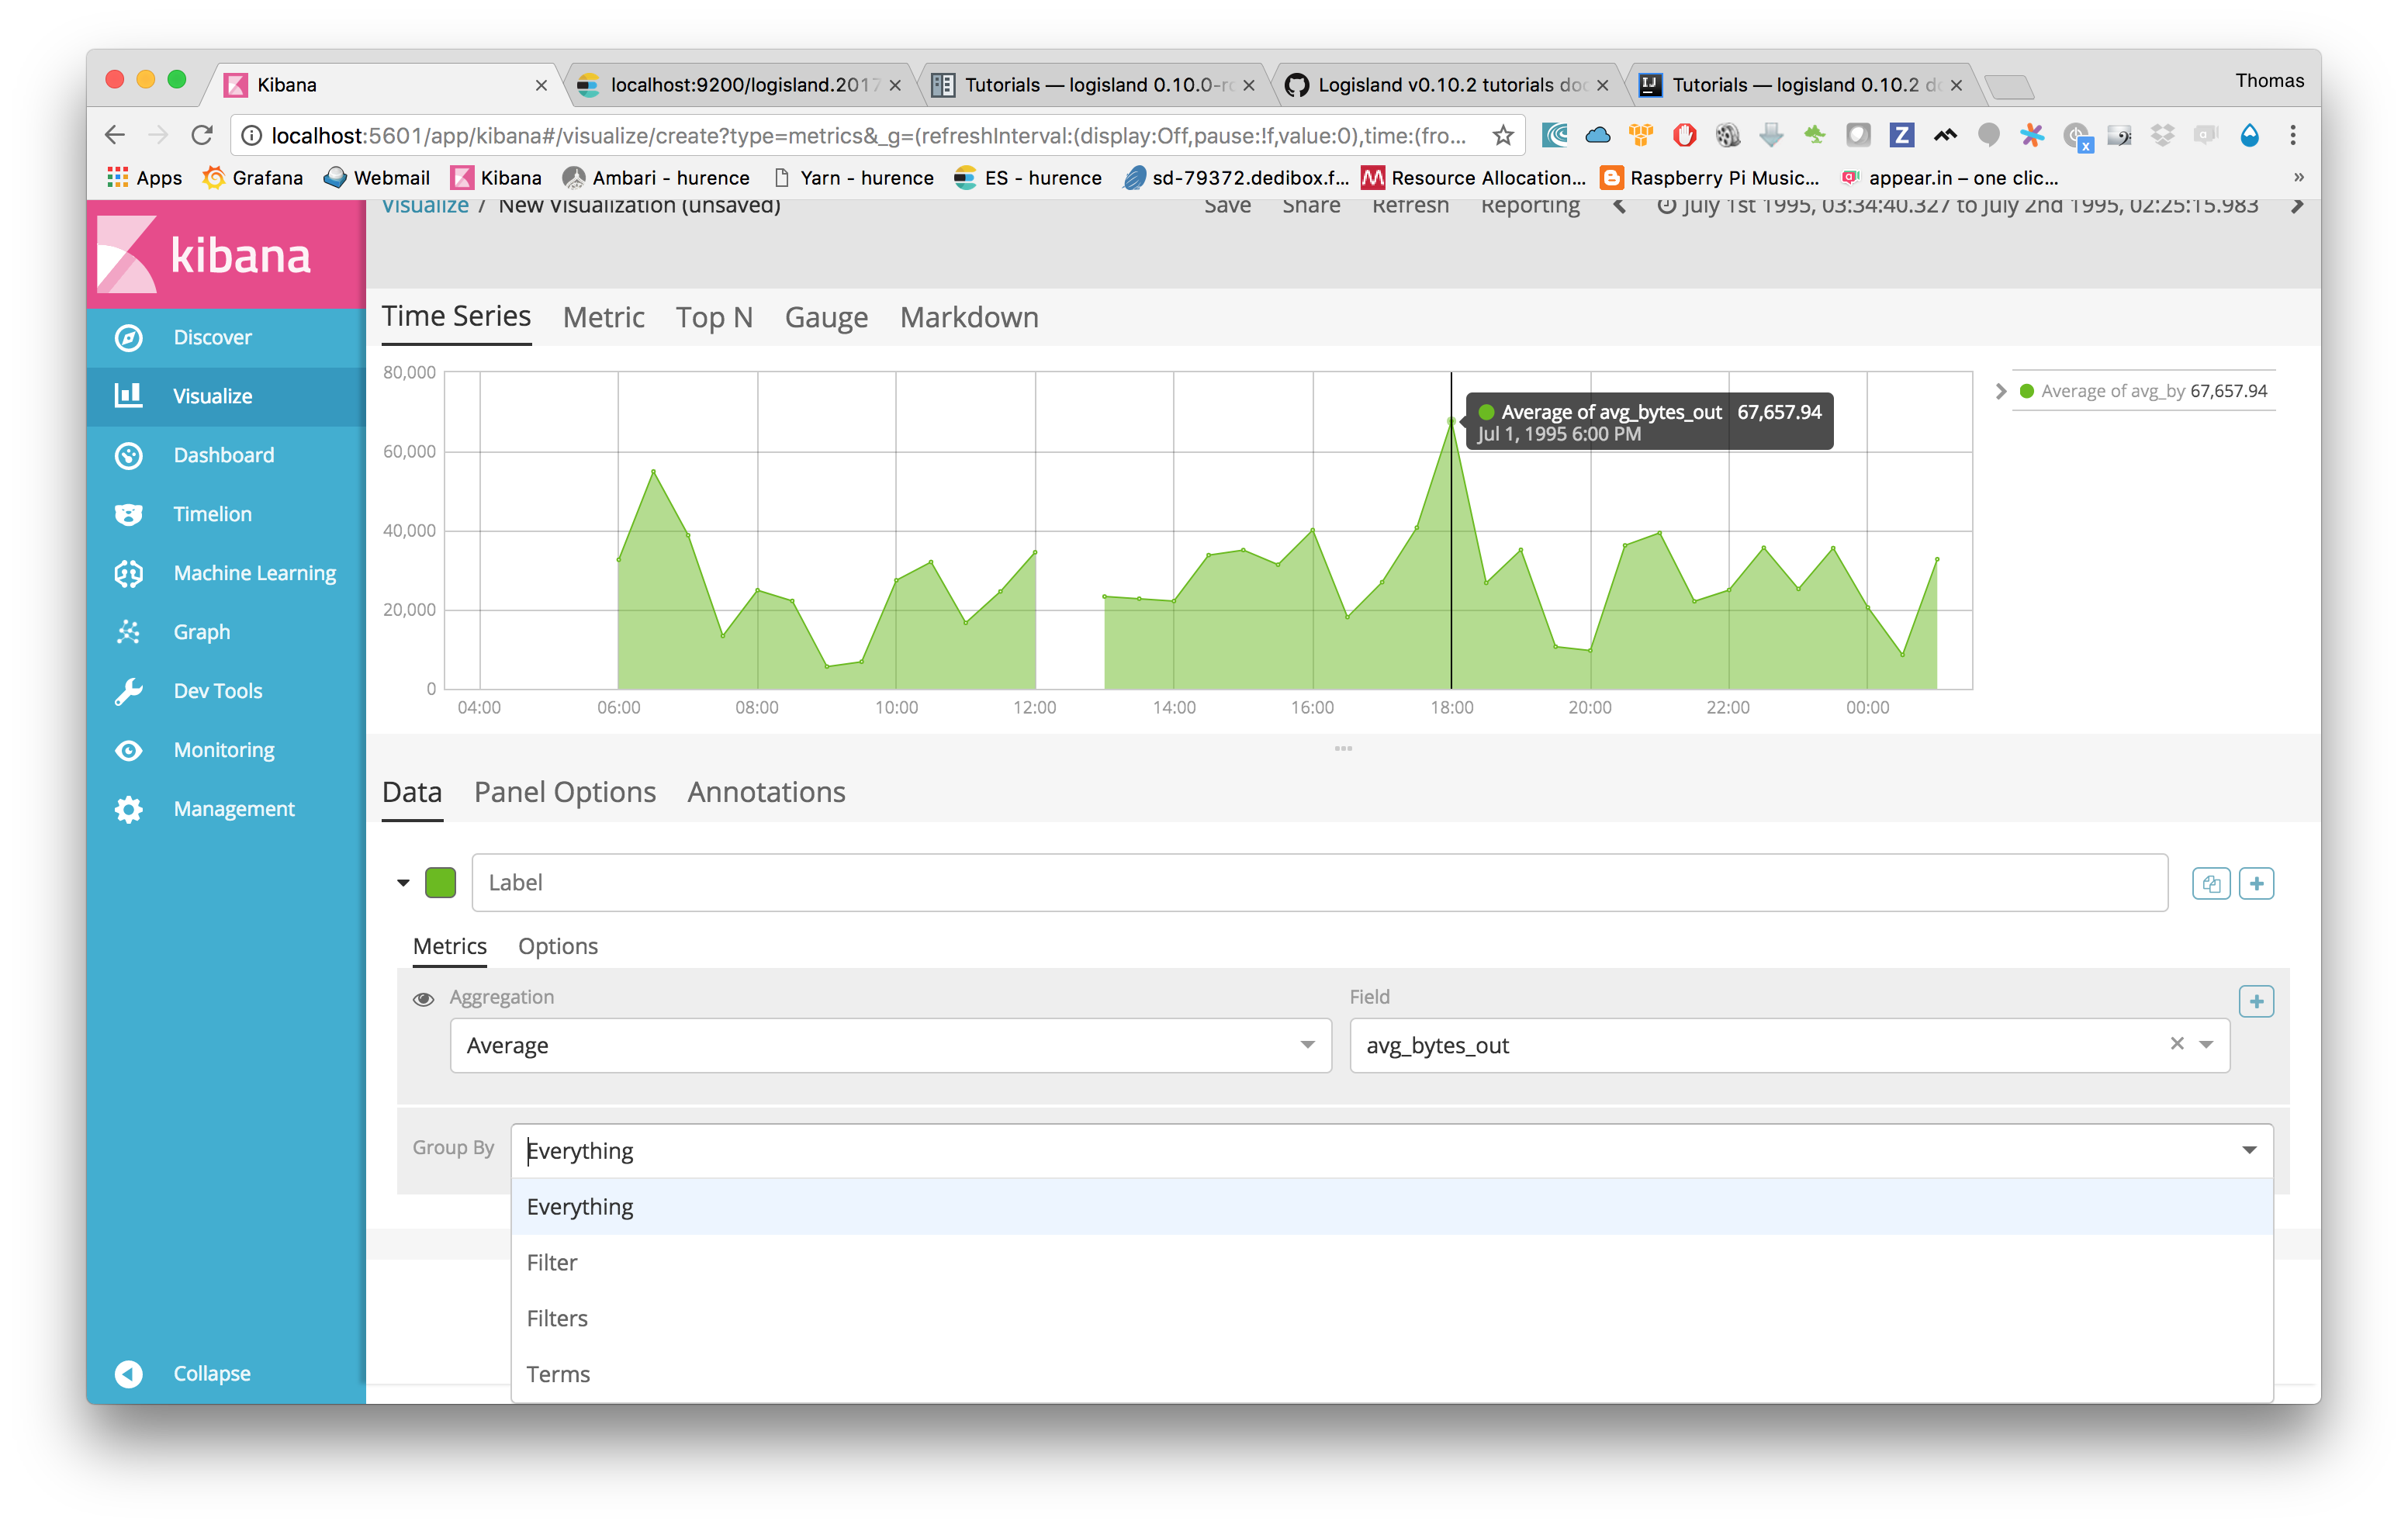
The most important part of the KafkaRecordStreamSQLAggregator is its sql.query property which defines a query to apply on the incoming records for the given time window.
The following SQL query will be applied on sliding window of 10” of records.
SELECT count(*) AS connections_count, avg(bytes_out) AS avg_bytes_out, src_ip, first(record_time) as record_time
FROM logisland_events
GROUP BY src_ip
ORDER BY connections_count DESC
LIMIT 20
which will consider logisland_events topic as SQL table and create 20 output Record with the fields avg_bytes_out, src_ip & record_time.
the statement with record_time will ensure that the created Records will correspond to the effective input event time (not the actual time).
- stream: metrics_by_host
  component: com.hurence.logisland.stream.spark.KafkaRecordStreamSQLAggregator
  type: stream
  documentation: a processor that links
  configuration:
    kafka.input.topics: logisland_events
    kafka.output.topics: logisland_aggregations
    kafka.error.topics: logisland_errors
    kafka.input.topics.serializer: com.hurence.logisland.serializer.KryoSerializer
    kafka.output.topics.serializer: com.hurence.logisland.serializer.KryoSerializer
    kafka.error.topics.serializer: com.hurence.logisland.serializer.JsonSerializer
    kafka.metadata.broker.list: sandbox:9092
    kafka.zookeeper.quorum: sandbox:2181
    kafka.topic.autoCreate: true
    kafka.topic.default.partitions: 2
    kafka.topic.default.replicationFactor: 1
    window.duration: 10
    avro.input.schema: >
      {  "version":1,
         "type": "record",
         "name": "com.hurence.logisland.record.apache_log",
         "fields": [
           { "name": "record_errors",   "type": [ {"type": "array", "items": "string"},"null"] },
           { "name": "record_raw_key", "type": ["string","null"] },
           { "name": "record_raw_value", "type": ["string","null"] },
           { "name": "record_id",   "type": ["string"] },
           { "name": "record_time", "type": ["long"] },
           { "name": "record_type", "type": ["string"] },
           { "name": "src_ip",      "type": ["string","null"] },
           { "name": "http_method", "type": ["string","null"] },
           { "name": "bytes_out",   "type": ["long","null"] },
           { "name": "http_query",  "type": ["string","null"] },
           { "name": "http_version","type": ["string","null"] },
           { "name": "http_status", "type": ["string","null"] },
           { "name": "identd",      "type": ["string","null"] },
           { "name": "user",        "type": ["string","null"] }    ]}
    sql.query: >
      SELECT count(*) AS connections_count, avg(bytes_out) AS avg_bytes_out, src_ip
      FROM logisland_events
      GROUP BY src_ip
      ORDER BY event_count DESC
      LIMIT 20
    max.results.count: 1000
    output.record.type: top_client_metrics
Here we will compute every x seconds, the top twenty src_ip for connections count. The result of the query will be pushed into to logisland_aggregations topic as new top_client_metrics Record containing connections_count and avg_bytes_out fields.
the third match some criteria to send some alerts
- processor: match_query
  component: com.hurence.logisland.processor.MatchQuery
  type: processor
  documentation: a parser that produce alerts from lucene queries
  configuration:
    numeric.fields: bytes_out,connections_count
    too_much_bandwidth: avg_bytes_out:[25000 TO 5000000]
    too_many_connections: connections_count:[150 TO 300]
    output.record.type: threshold_alert
3. Launch the script
For this tutorial we will handle some apache logs with a splitText parser and send them to Elastiscearch Connect a shell to your logisland container to launch the following streaming jobs.
docker exec -i -t logisland bin/logisland.sh --conf conf/aggregate-events.yml
4. Inject some Apache logs into the system
Now we’re going to send some logs to logisland_raw Kafka topic.
We could setup a logstash or flume agent to load some apache logs into a kafka topic but there’s a super useful tool in the Kafka ecosystem : kafkacat, a generic command line non-JVM Apache Kafka producer and consumer which can be easily installed.
If you don’t have your own httpd logs available, you can use some freely available log files from NASA-HTTP web site access:
- Jul 01 to Jul 31, ASCII format, 20.7 MB gzip compressed
- Aug 04 to Aug 31, ASCII format, 21.8 MB gzip compressed
Let’s send the first 500000 lines of NASA http access over July 1995 to LogIsland with kafkacat to logisland_raw Kafka topic
cd /tmp
wget ftp://ita.ee.lbl.gov/traces/NASA_access_log_Jul95.gz
gunzip NASA_access_log_Jul95.gz
head -500000 NASA_access_log_Jul95 | kafkacat -b sandbox:9092 -t logisland_raw
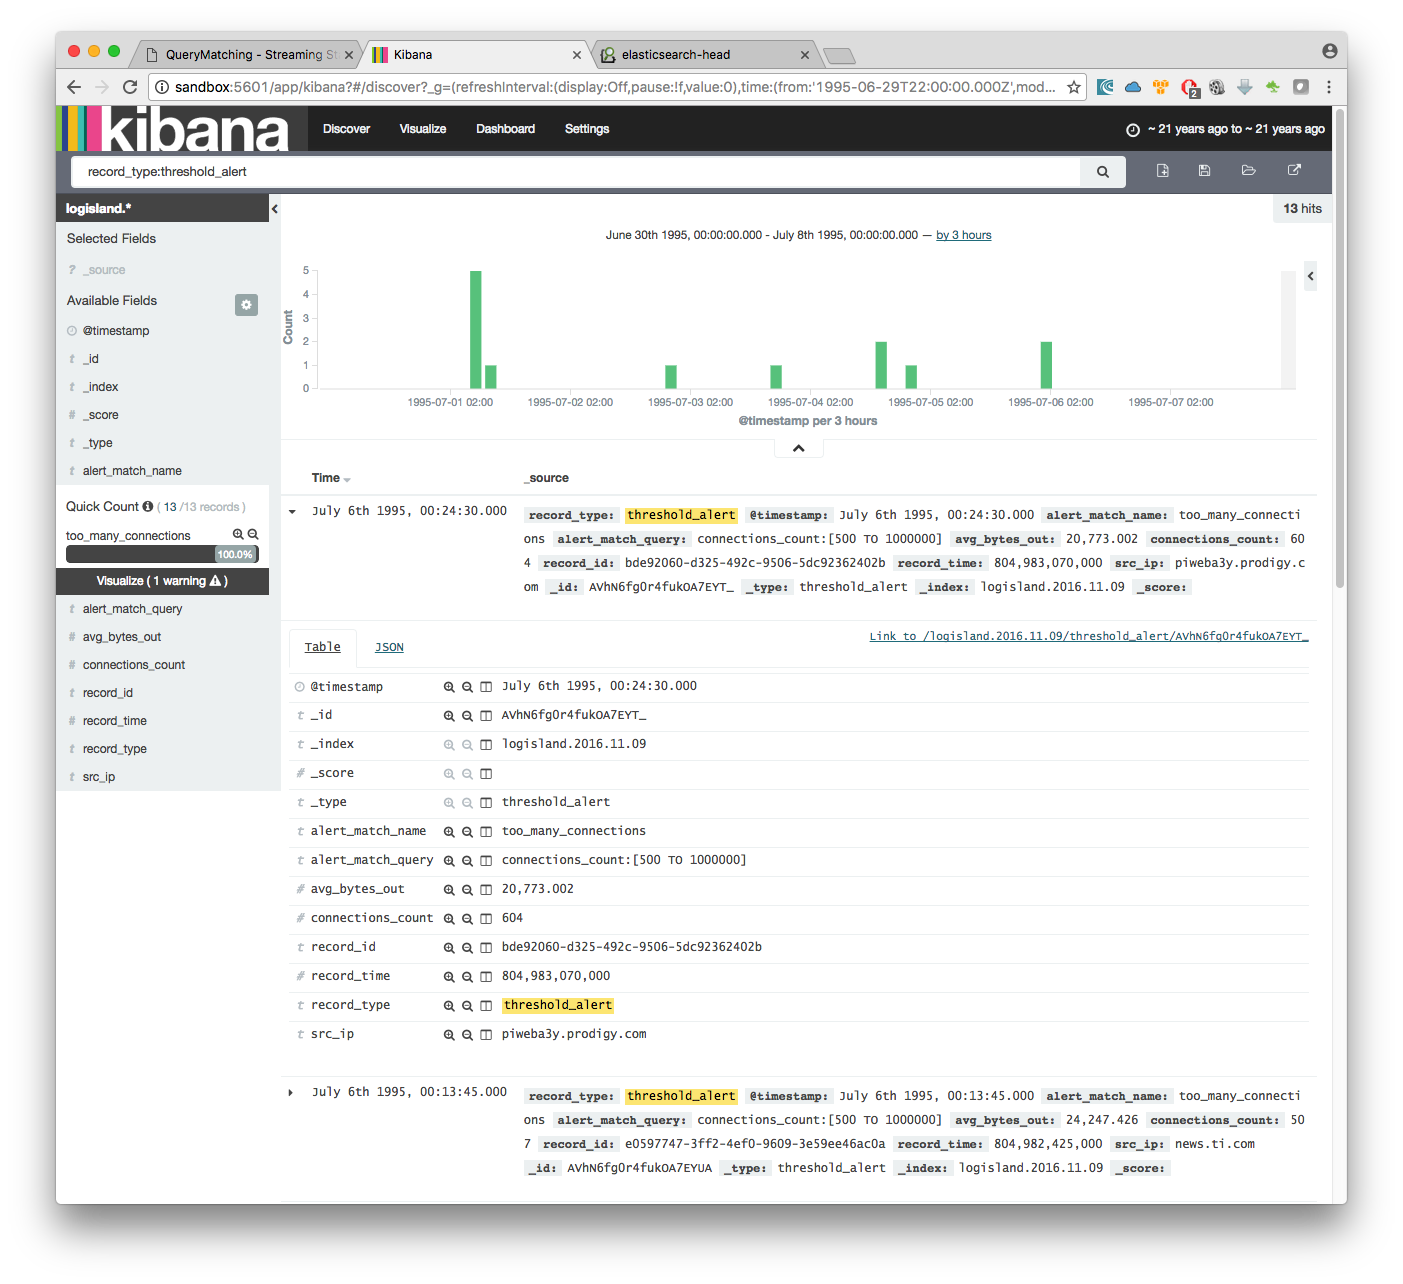
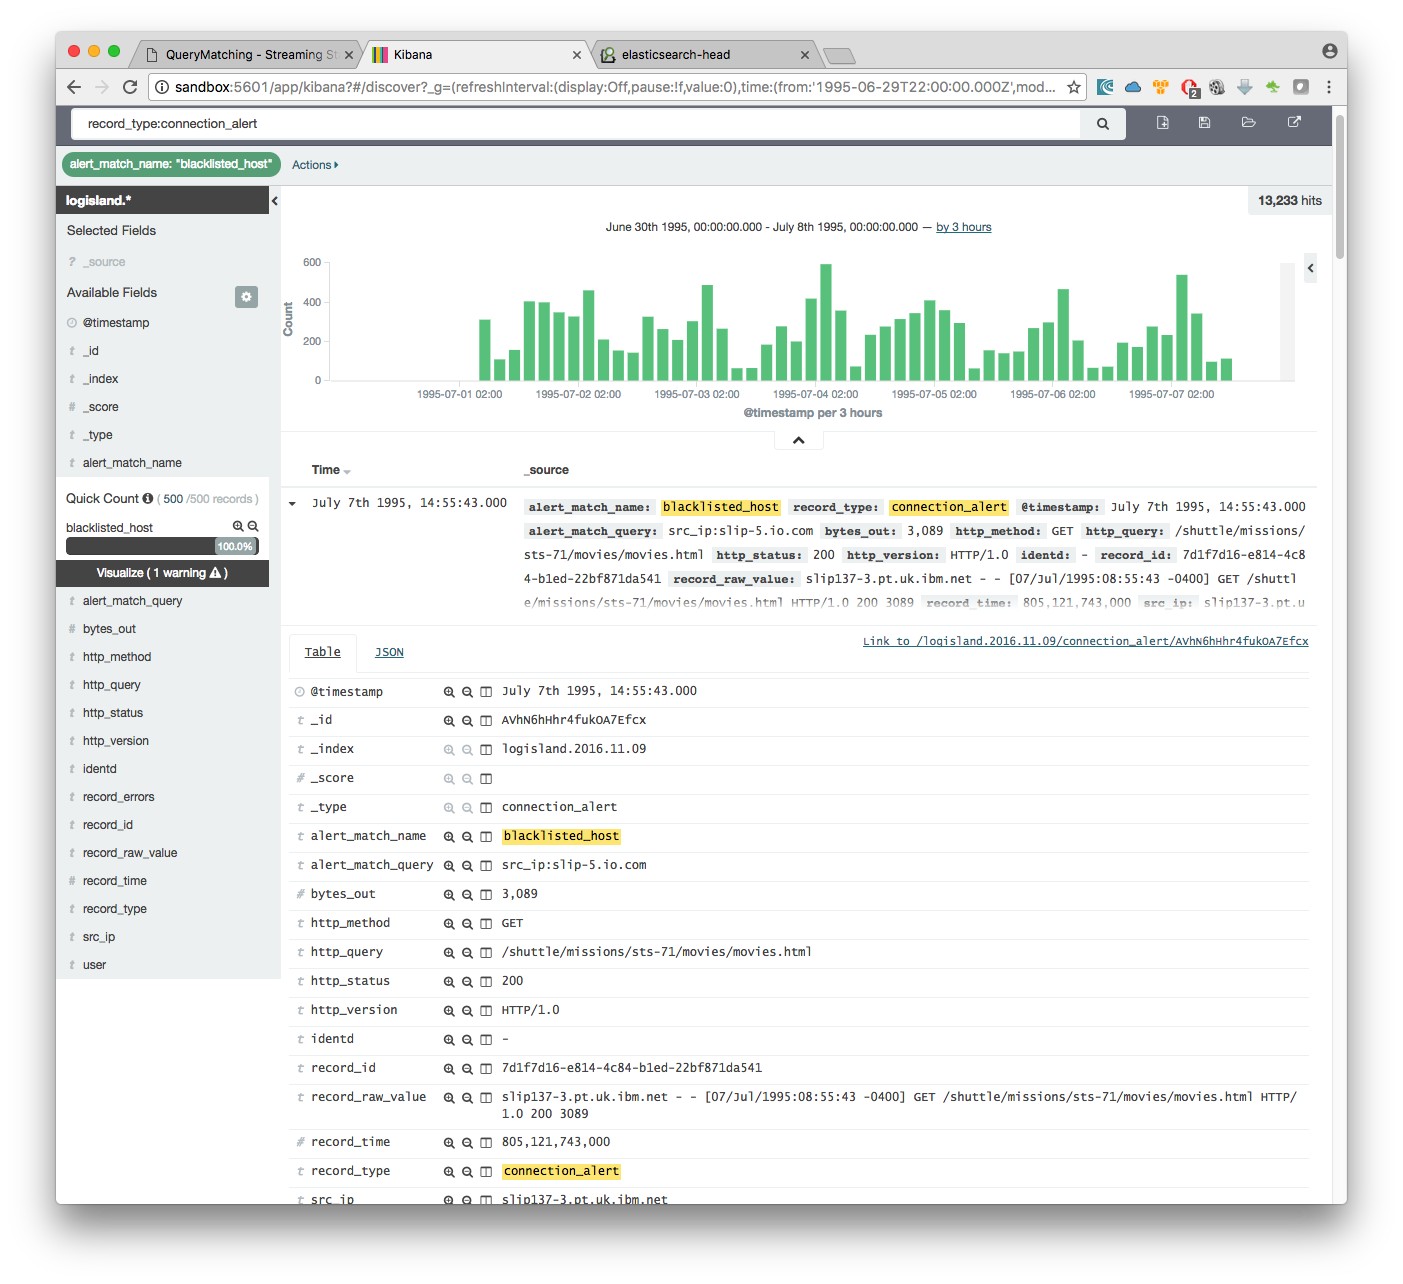
5. Check your alerts with Kibana
As we explore data logs from july 1995 we’ll have to select an absolute time filter from 1995-06-30 to 1995-07-08 to see the events.
you can filter your events with record_type:connection_alert to get 71733 connections alerts matching your query
if we filter now on threshold alerts whith record_type:threshold_alert you’ll get the 13 src_ip that have been catched by the threshold query.