Alerts & Query Matching
In the following tutorial we’ll learn how to generate time window metrics on some http traffic (apache log records) and how to raise custom alerts based on lucene matching query criterion.
We assume that you already know how to parse and ingest Apache logs into logisland. If it’s not the case please refer to the previous Apache logs indexing tutorial. We will first add an SQLAggregator Stream to compute some metrics and then add a MatchQuery Processor.
Note
You can download the latest release of logisland and the YAML configuration file for this tutorial which can be also found under $LOGISLAND_HOME/conf directory.
1. Setup SQL Aggregation Stream
Our application will be composed of 2 streams, the first one use a KafkaRecordStreamSQLAggregator. This stream defines input/output topics names as well as Serializers, avro schema.
Note
The Avro schema is set for the input topic and must be same as the avro schema of the output topic for the stream that produces the records (please refer to Index Apache logs tutorial
The most important part of the KafkaRecordStreamSQLAggregator is its sql.query property which defines a query to apply on the incoming records for the given time window.
The following SQL query will be applied
SELECT count(*) AS connections_count, avg(bytes_out) AS avg_bytes_out, src_ip, first(record_time) as record_time
FROM logisland_events
GROUP BY src_ip
ORDER BY connections_count DESC
LIMIT 20
which will consider logisland_events topic as SQL table and create 20 output Record with the fields avg_bytes_out, src_ip & record_time.
the statement with record_time will ensure that the created Records will correspond to the effective input event time (not the actual time).
- stream: metrics_by_host
  component: com.hurence.logisland.stream.spark.KafkaRecordStreamSQLAggregator
  type: stream
  documentation: a processor that links
  configuration:
    kafka.input.topics: logisland_events
    kafka.output.topics: logisland_aggregations
    kafka.error.topics: logisland_errors
    kafka.input.topics.serializer: com.hurence.logisland.serializer.KryoSerializer
    kafka.output.topics.serializer: com.hurence.logisland.serializer.KryoSerializer
    kafka.error.topics.serializer: com.hurence.logisland.serializer.JsonSerializer
    kafka.metadata.broker.list: sandbox:9092
    kafka.zookeeper.quorum: sandbox:2181
    kafka.topic.autoCreate: true
    kafka.topic.default.partitions: 2
    kafka.topic.default.replicationFactor: 1
    avro.input.schema: >
      {  "version":1,
         "type": "record",
         "name": "com.hurence.logisland.record.apache_log",
         "fields": [
           { "name": "record_errors",   "type": [ {"type": "array", "items": "string"},"null"] },
           { "name": "record_raw_key", "type": ["string","null"] },
           { "name": "record_raw_value", "type": ["string","null"] },
           { "name": "record_id",   "type": ["string"] },
           { "name": "record_time", "type": ["long"] },
           { "name": "record_type", "type": ["string"] },
           { "name": "src_ip",      "type": ["string","null"] },
           { "name": "http_method", "type": ["string","null"] },
           { "name": "bytes_out",   "type": ["long","null"] },
           { "name": "http_query",  "type": ["string","null"] },
           { "name": "http_version","type": ["string","null"] },
           { "name": "http_status", "type": ["string","null"] },
           { "name": "identd",      "type": ["string","null"] },
           { "name": "user",        "type": ["string","null"] }    ]}
    sql.query: >
      SELECT count(*) AS connections_count, avg(bytes_out) AS avg_bytes_out, src_ip
      FROM logisland_events
      GROUP BY src_ip
      ORDER BY event_count DESC
      LIMIT 20
    max.results.count: 1000
    output.record.type: top_client_metrics
Here we will compute every x seconds, the top twenty src_ip for connections count. The result of the query will be pushed into to logisland_aggregations topic as new top_client_metrics Record containing connections_count and avg_bytes_out fields.
2. Setup Query matching Stream on log Records
The second stream makes use of the KafkaRecordStreamParallelProcessing Stream with a MatchQuery Processor. This processor provides user with dynamic query registration. This queries are expressed in the Lucene syntax.
Note
Please read the Lucene syntax guide for supported operations.
We’ll use 2 streams for query matching because we will handle 2 kind of Records. The first one will send an alert when a particular host (src_ip:199.0.2.27) will make a connection and anywhen someone from .edu domain makes a connection (src_ip:.edu).
# match threshold queries
- stream: query_matching_stream
  component: com.hurence.logisland.stream.spark.KafkaRecordStreamParallelProcessing
  type: stream
  documentation: a processor that match query in parrallel
  configuration:
    kafka.input.topics: logisland_events
    kafka.output.topics: logisland_alerts
    kafka.error.topics: logisland_errors
    kafka.input.topics.serializer: com.hurence.logisland.serializer.KryoSerializer
    kafka.output.topics.serializer: com.hurence.logisland.serializer.KryoSerializer
    kafka.error.topics.serializer: com.hurence.logisland.serializer.JsonSerializer
    kafka.metadata.broker.list: sandbox:9092
    kafka.zookeeper.quorum: sandbox:2181
    kafka.topic.autoCreate: true
    kafka.topic.default.partitions: 2
    kafka.topic.default.replicationFactor: 1
  processorConfigurations:
    - processor: match_query
      component: com.hurence.logisland.processor.MatchQuery
      type: processor
      documentation: a parser that produce events from an apache log REGEX
      configuration:
        blacklisted_host: src_ip:slip-5.io.com
        edu_host: src_ip:edu
        output.record.type: connection_alert
3. Setup Query matching Stream
The third one will match numeric fields on sql aggregates computed in the very first stream in this tutorial.
# match threshold queries
- stream: query_matching_stream
  component: com.hurence.logisland.stream.spark.KafkaRecordStreamParallelProcessing
  type: stream
  documentation: a processor that match query in parrallel
  configuration:
    kafka.input.topics: logisland_aggregations
    kafka.output.topics: logisland_alerts
    kafka.error.topics: logisland_errors
    kafka.input.topics.serializer: com.hurence.logisland.serializer.KryoSerializer
    kafka.output.topics.serializer: com.hurence.logisland.serializer.KryoSerializer
    kafka.error.topics.serializer: com.hurence.logisland.serializer.JsonSerializer
    kafka.metadata.broker.list: sandbox:9092
    kafka.zookeeper.quorum: sandbox:2181
    kafka.topic.autoCreate: true
    kafka.topic.default.partitions: 2
    kafka.topic.default.replicationFactor: 1
  processorConfigurations:
    - processor: match_query
      component: com.hurence.logisland.processor.MatchQuery
      type: processor
      documentation: a parser that produce events from an apache log REGEX
      configuration:
        numeric.fields: bytes_out,connections_count
        too_much_bandwidth: average_bytes:[100 TO 50000]
        too_many_connections: connections_count:[500 TO 1000000]
        output.record.type: threshold_alert
4. Start logisland application
Connect a shell to your logisland container to launch the following stream processing job previously defined.
docker exec -ti logisland bash

#launch logisland streams
cd $LOGISLAND_HOME
bin/logisland.sh --conf conf/index-apache-logs.yml
bin/logisland.sh --conf conf/query-matching.yml

# send logs to kafka
head 500000 NASA_access_log_Jul95 | kafkacat -b sandbox:9092 -t logisland_raw
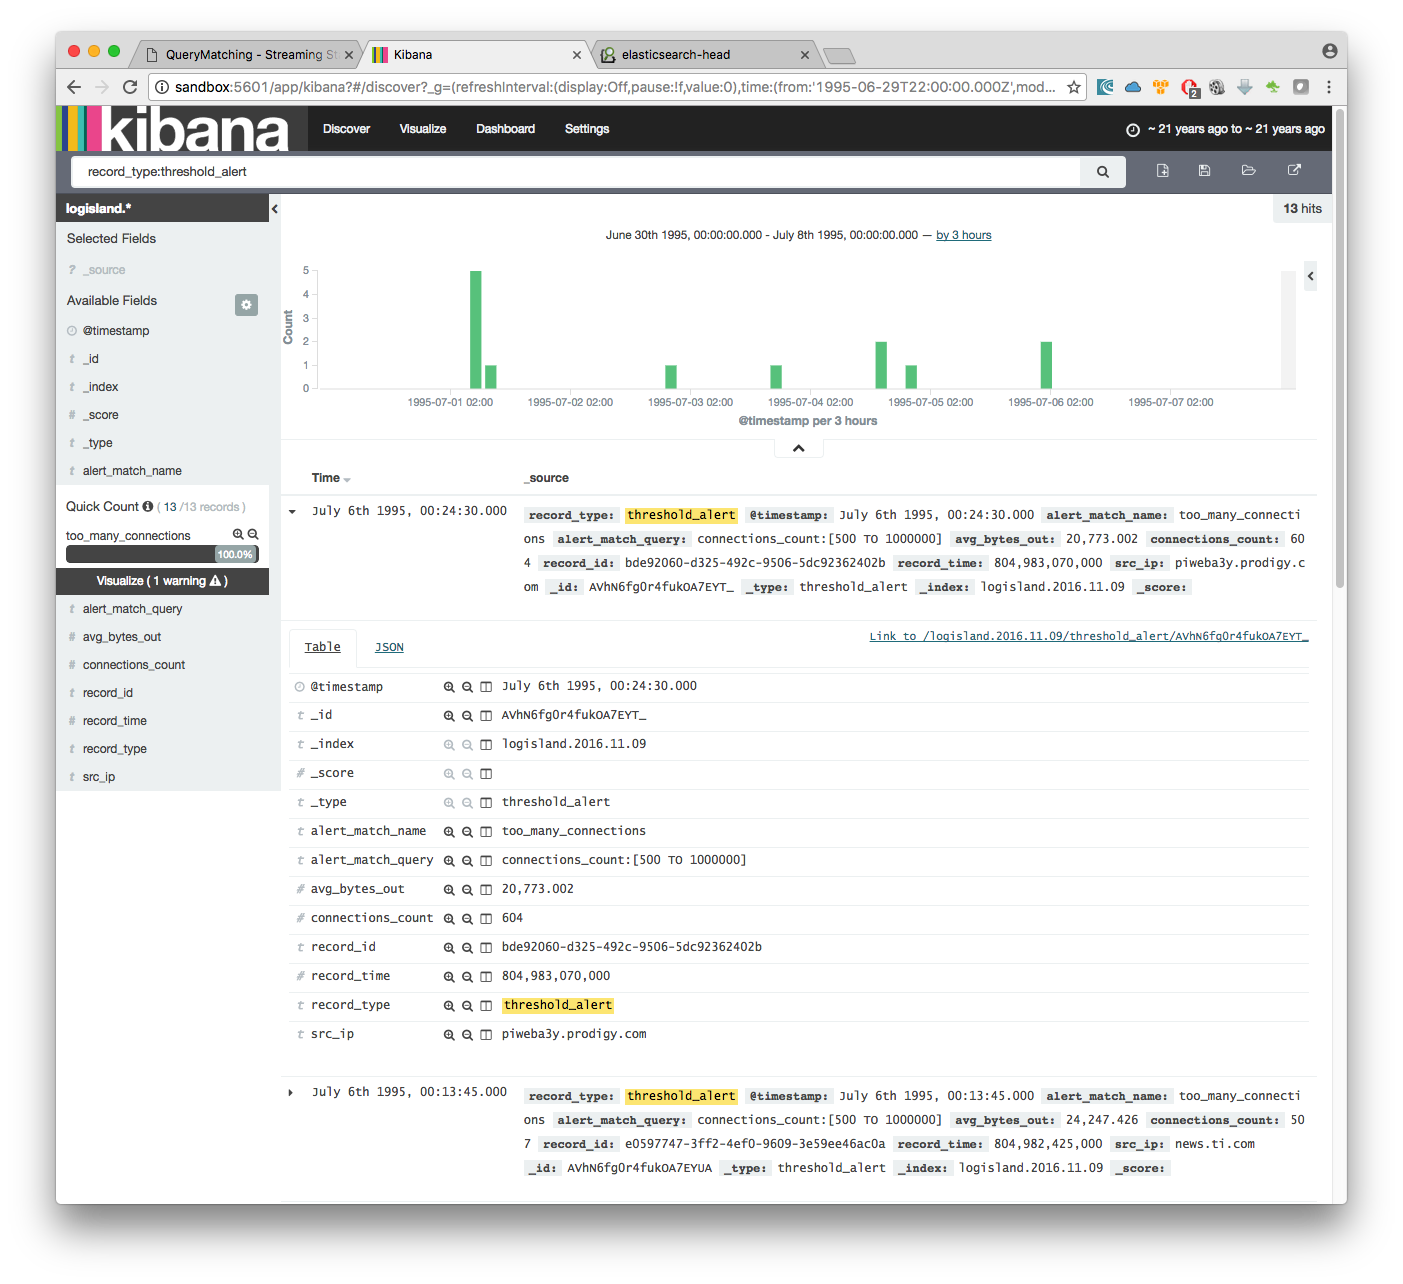
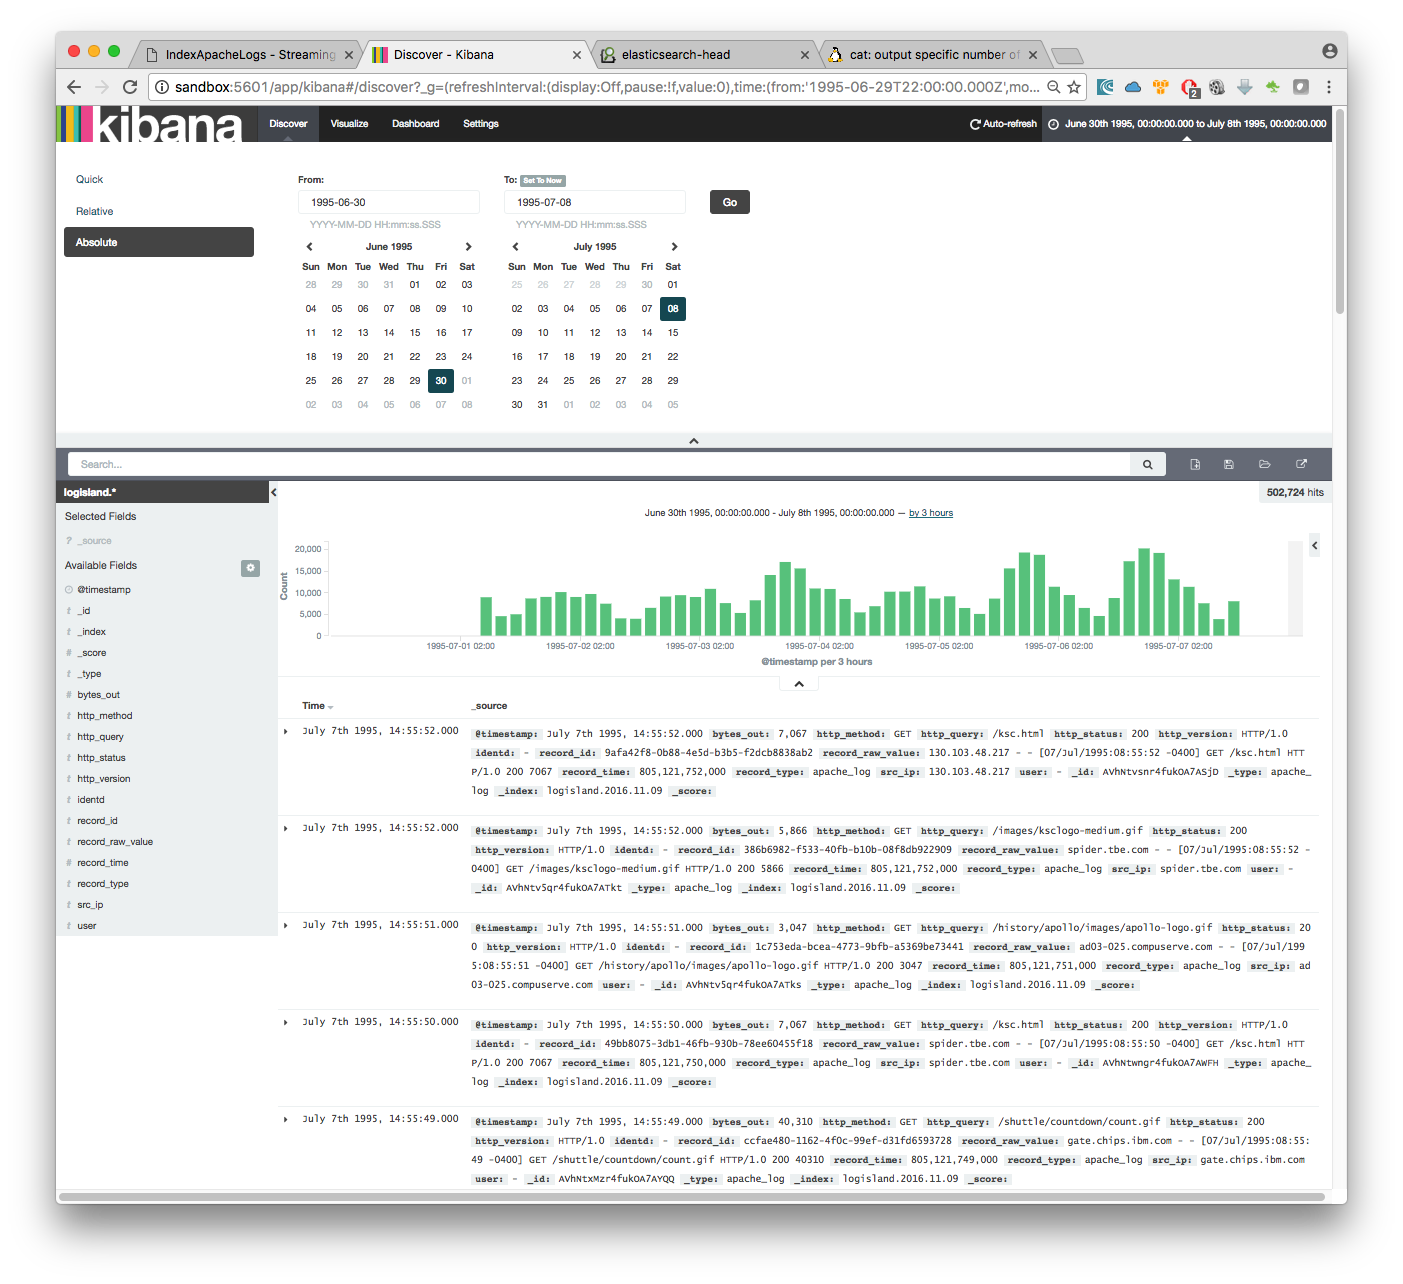
5. Check your alerts with Kibana
Open up your browser and go to http://sandbox:5601/ and you should be able to explore your apache logs.
As we explore data logs from july 1995 we’ll have to select an absolute time filter from 1995-06-30 to 1995-07-08 to see the events.
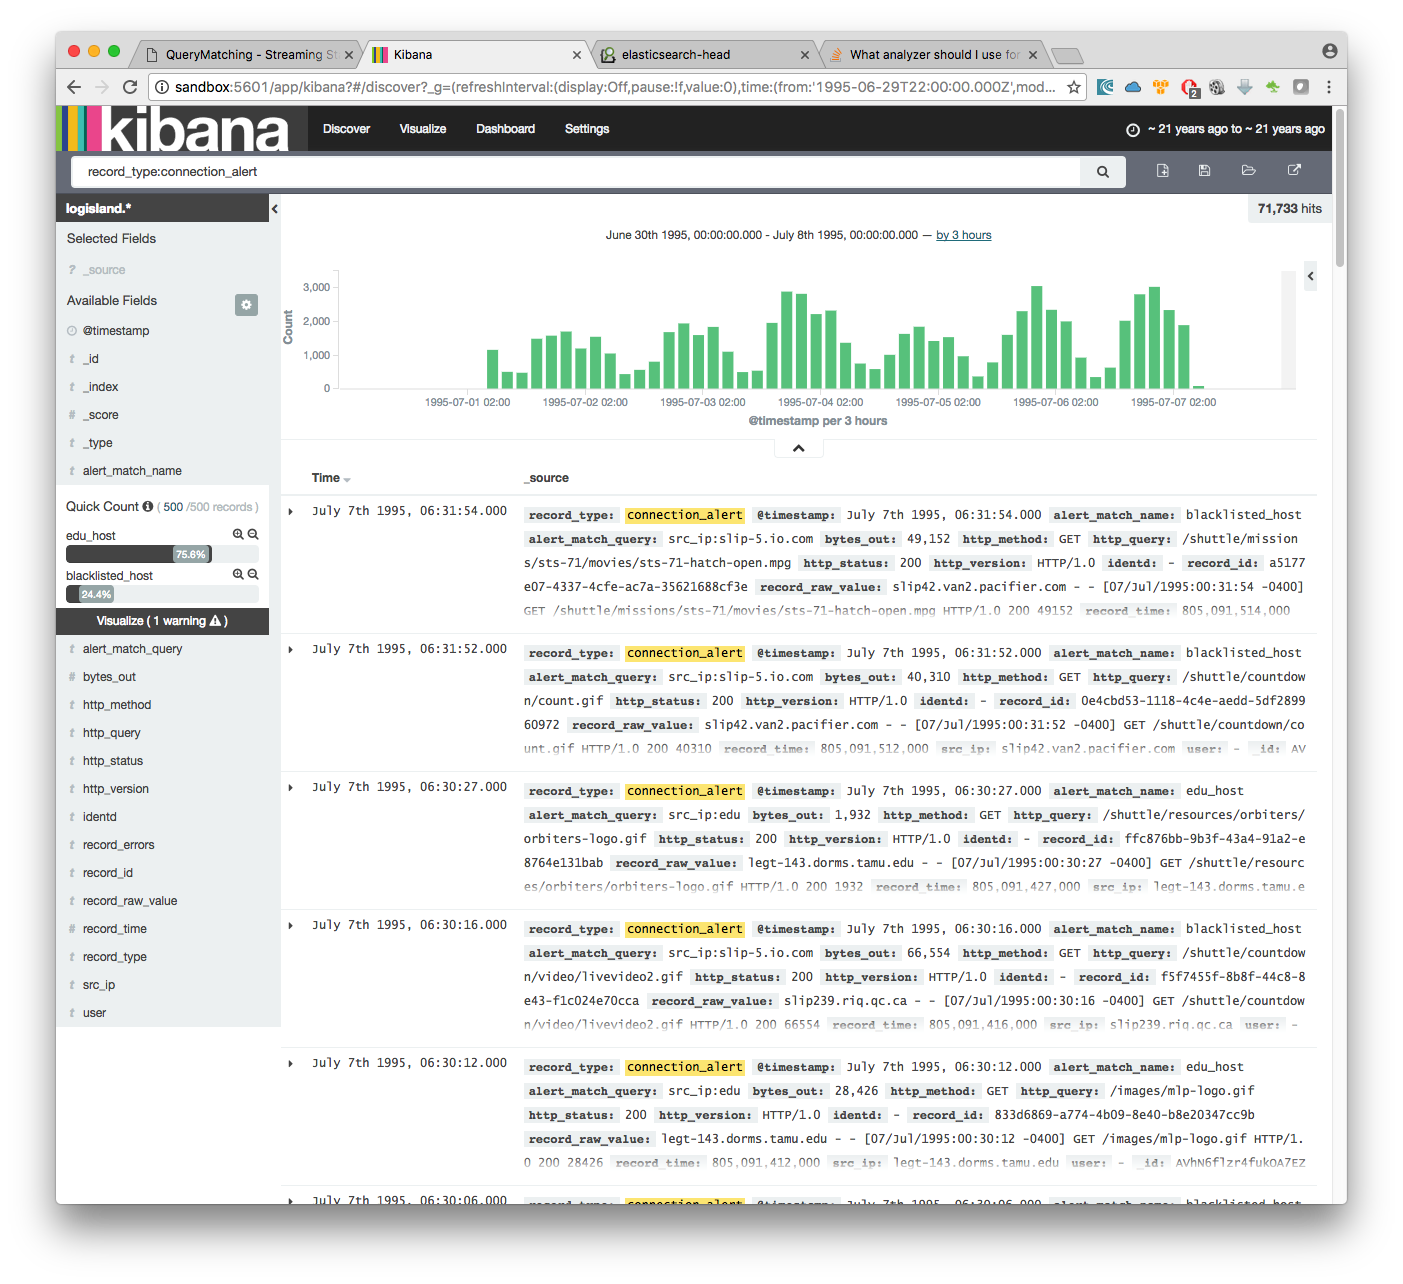
you can filter your events with record_type:connection_alert to get 71733 connections alerts matching your query
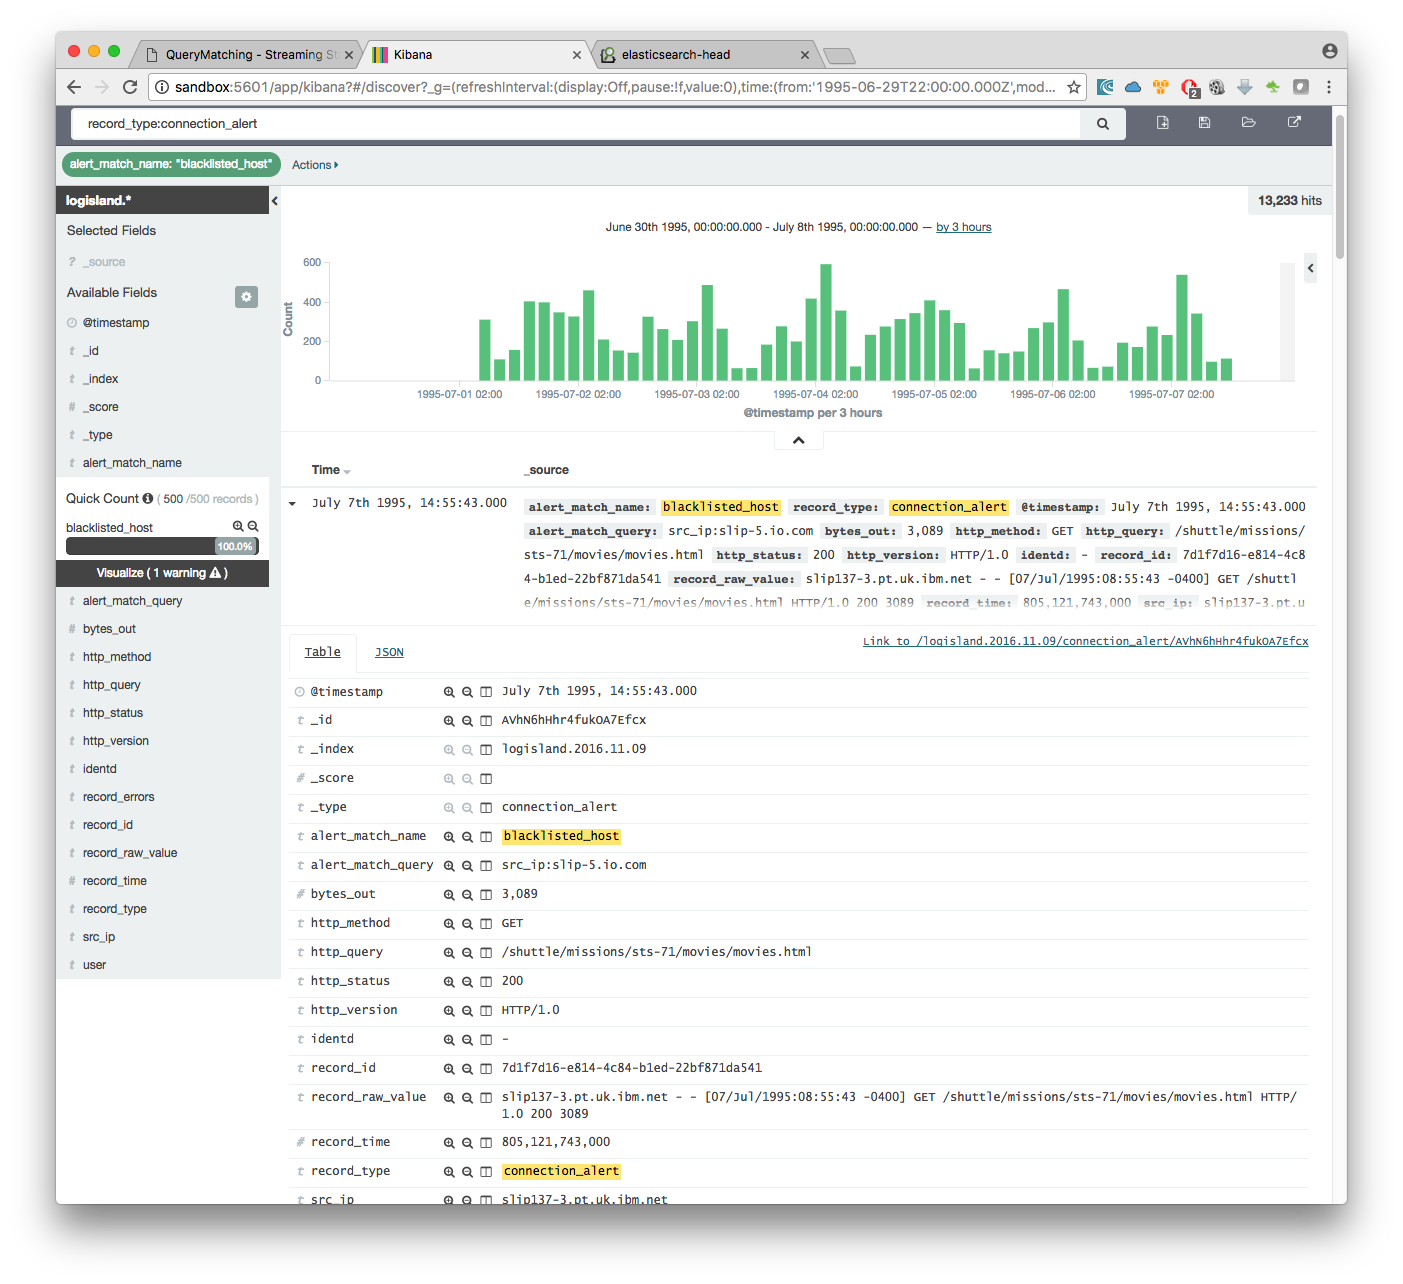
by adding another filter on alert_match_name:blacklisted_host you’ll only get request from slip-5.io.com which is a host we where monitoring.
if we filter now on threshold alerts whith record_type:threshold_alert you’ll get the 13 src_ip that have been catched by the threshold query.