Index Apache logs Enrichment
In the following tutorial we’ll drive you through the process of enriching Apache logs with LogIsland platform.
One of the first steps when treating web access logs is to extract information from the User-Agent header string, in order to be able to classify traffic. The User-Agent string is part of the access logs from the web server (this is the last field in the example below).
Another step is to find the FQDN (full qualified domain name) from an ip address.
That string is packed with information from the visitor, when you know how to interpret it. However, the User-Agent string is not based on any standard, and it is not trivial to extract meaningful information from it. LogIsland provides a processor, based on the YAUAA library, that simplifies that treatement.
LogIsland provides a processor, based on InetAdress class from JDK 8, that use reverse Dns to determine FQDN from an IP.
Note
This class find FQDN from ip using IN-ADDR.ARPA (or IP6.ARPA for ipv6). If it finds a domain name, it verifies that it matches back the same address ip in order to prevent against IP spoofing attack. If you want to return the ip anyway, you should implement a new plugin using another library as dnsjava for example or open an issue for asking this feature.
We will reuse the Docker container hosting all the LogIsland services from the previous tutorial, and add the User-Agent as well as the IpToFqdn processor to the stream
Note
You can download the latest release of logisland and the YAML configuration file for this tutorial which can be also found under $LOGISLAND_HOME/conf directory.
1. Start LogIsland as a Docker container
LogIsland is packaged as a Docker container that you can build yourself or pull from Docker Hub.
You can find the steps to start the Docker image and start the LogIsland server in the previous tutorial. However, you’ll start the server with a different configuration file (that already includes the necessary modifications)
Install required components
For this tutorial please make sure to already have installed required modules.
If not you can just do it through the components.sh command line:
bin/components.sh -i com.hurence.logisland:logisland-processor-elasticsearch:1.1.1

bin/components.sh -i com.hurence.logisland:logisland-service-elasticsearch_2_4_0-client:1.1.1

bin/components.sh -i com.hurence.logisland:logisland-processor-enrichment:1.1.1

bin/components.sh -i com.hurence.logisland:logisland-processor-useragent:1.1.1
Stream 1 : modify the stream to analyze the User-Agent string
Note
You can either apply the modifications from this section to the file conf/index-apache-logs.yml ot directly use the file conf/enrich-apache-logs.yml that already includes them.
The stream needs to be modified to
* modify the regex to add the referer and the User-Agent strings for the SplitText processor
* modify the Avro schema to include the new fields returned by the UserAgentProcessor
* include the processing of the User-Agent string after the parsing of the logs
* include the processor IpToFqdn after the ParserUserAgent
* include a cache service to use with IpToFqdn processor
The example below shows how to include all of the fields supported by the processor.
Note
It is possible to remove unwanted fields from both the processor configuration and the Avro schema
Once the configuration file is updated, LogIsland must be restarted with that new configuration file.
bin/logisland.sh --conf <new_configuration_file>
2. Inject some Apache logs into the system
Now we’re going to send some logs to logisland_raw Kafka topic.
We could setup a logstash or flume agent to load some apache logs into a kafka topic but there’s a super useful tool in the Kafka ecosystem : kafkacat, a generic command line non-JVM Apache Kafka producer and consumer which can be easily installed (and is already present in the docker image).
If you don’t have your own httpd logs available, you can use some freely available log files from Elastic web site
Let’s send the first 500000 lines of access log to LogIsland with kafkacat to logisland_raw Kafka topic
docker exec -ti logisland bash
cd /tmp
wget https://raw.githubusercontent.com/elastic/examples/master/ElasticStack_apache/apache_logs
head -500000 apache_logs | kafkacat -b sandbox:9092 -t logisland_raw
Note
The process should last around 280 seconds because reverse dns is a costly operation. After all data are processed, you can inject the same logs again and it should be very fast to process thanks to the cache that saved all matched ip.
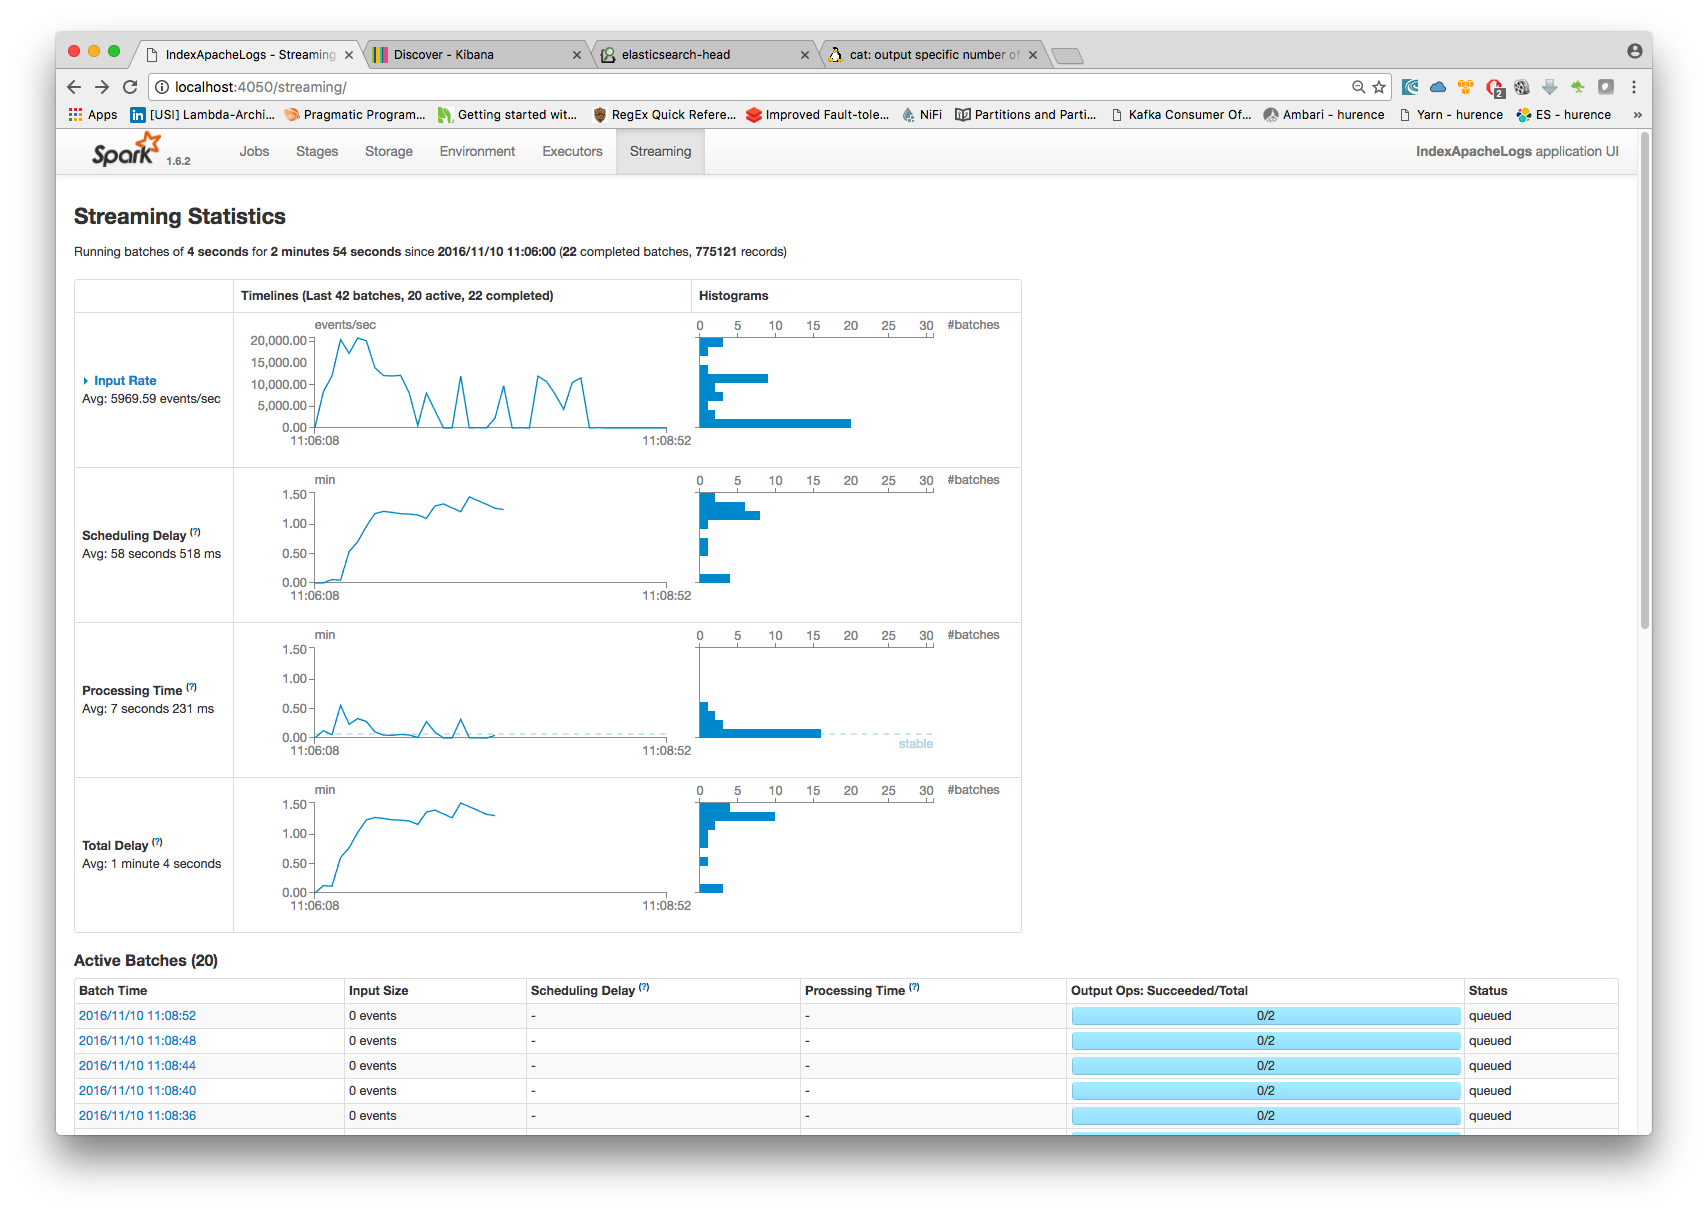
3. Monitor your spark jobs and Kafka topics
Now go to http://sandbox:4050/streaming/ to see how fast Spark can process your data
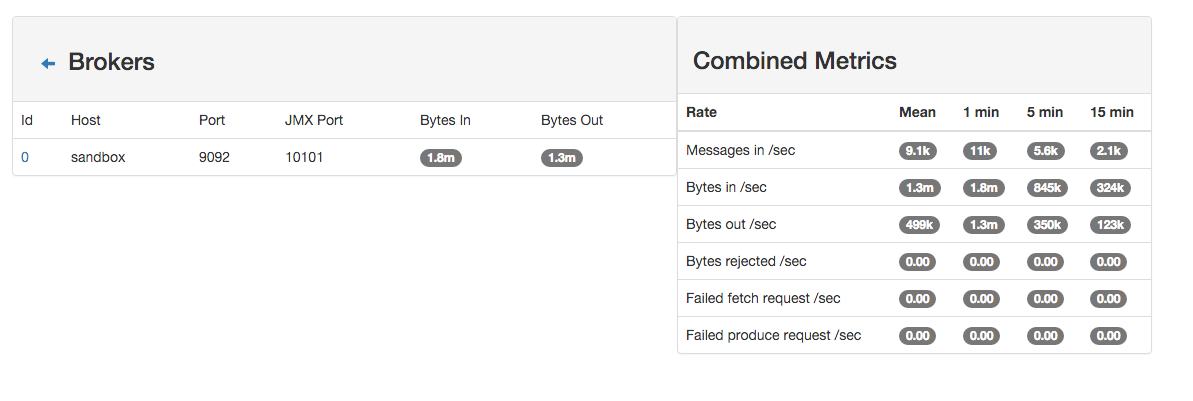
Another tool can help you to tweak and monitor your processing http://sandbox:9000/
4. Use Kibana to inspect the logs
You’ve completed the enrichment of your logs using the User-Agent processor. The logs are now loaded into elasticSearch, in the following form :
curl -XGET http://localhost:9200/logisland.*/_search?pretty
{

    "_index": "logisland.2017.03.21",
    "_type": "apache_log",
    "_id": "4ca6a8b5-1a60-421e-9ae9-6c30330e497e",
    "_score": 1.0,
    "_source": {
        "@timestamp": "2015-05-17T10:05:43Z",
        "agentbuild": "Unknown",
        "agentclass": "Browser",
        "agentinformationemail": "Unknown",
        "agentinformationurl": "Unknown",
        "agentlanguage": "Unknown",
        "agentlanguagecode": "Unknown",
        "agentname": "Chrome",
        "agentnameversion": "Chrome 32.0.1700.77",
        "agentnameversionmajor": "Chrome 32",
        "agentsecurity": "Unknown",
        "agentuuid": "Unknown",
        "agentversion": "32.0.1700.77",
        "agentversionmajor": "32",
        "anonymized": "Unknown",
        "devicebrand": "Apple",
        "deviceclass": "Desktop",
        "devicecpu": "Intel",
        "devicefirmwareversion": "Unknown",
        "devicename": "Apple Macintosh",
        "deviceversion": "Unknown",
        "facebookcarrier": "Unknown",
        "facebookdeviceclass": "Unknown",
        "facebookdevicename": "Unknown",
        "facebookdeviceversion": "Unknown",
        "facebookfbop": "Unknown",
        "facebookfbss": "Unknown",
        "facebookoperatingsystemname": "Unknown",
        "facebookoperatingsystemversion": "Unknown",
        "gsainstallationid": "Unknown",
        "hackerattackvector": "Unknown",
        "hackertoolkit": "Unknown",
        "iecompatibilitynameversion": "Unknown",
        "iecompatibilitynameversionmajor": "Unknown",
        "iecompatibilityversion": "Unknown",
        "iecompatibilityversionmajor": "Unknown",
        "koboaffiliate": "Unknown",
        "koboplatformid": "Unknown",
        "layoutenginebuild": "Unknown",
        "layoutengineclass": "Browser",
        "layoutenginename": "Blink",
        "layoutenginenameversion": "Blink 32.0",
        "layoutenginenameversionmajor": "Blink 32",
        "layoutengineversion": "32.0",
        "layoutengineversionmajor": "32",
        "operatingsystemclass": "Desktop",
        "operatingsystemname": "Mac OS X",
        "operatingsystemnameversion": "Mac OS X 10.9.1",
        "operatingsystemversion": "10.9.1",
        "operatingsystemversionbuild": "Unknown",
        "webviewappname": "Unknown",
        "webviewappnameversionmajor": "Unknown",
        "webviewappversion": "Unknown",
        "webviewappversionmajor": "Unknown",
        "bytes_out": 171717,
        "http_method": "GET",
        "http_query": "/presentations/logstash-monitorama-2013/images/kibana-dashboard3.png",
        "http_referer": "http://semicomplete.com/presentations/logstash-monitorama-2013/",
        "http_status": "200",
        "http_user_agent": "Mozilla/5.0 (Macintosh; Intel Mac OS X 10_9_1) AppleWebKit/537.36 (KHTML, like Gecko) Chrome/32.0.1700.77 Safari/537.36",
        "http_version": "HTTP/1.1",
        "identd": "-",
        "record_id": "4ca6a8b5-1a60-421e-9ae9-6c30330e497e",
        "record_raw_value": "83.149.9.216 - - [17/May/2015:10:05:43 +0000] \"GET /presentations/logstash-monitorama-2013/images/kibana-dashboard3.png HTTP/1.1\" 200 171717 \"http://semicomplete.com/presentations/logstash-monitorama-2013/\" \"Mozilla/5.0 (Macintosh; Intel Mac OS X 10_9_1) AppleWebKit/537.36 (KHTML, like Gecko) Chrome/32.0.1700.77 Safari/537.36\"",
        "record_time": 1431857143000,
        "record_type": "apache_log",
        "src_ip": "83.149.9.216",
        "user": "-"
    }
}
You can now browse your data in Kibana and build great dashboards