IIoT with MQTT and Logisland Data-Historian
In the following getting tutorial we’ll drive you through the process of IIoT enablement with LogIsland platform.
Note
Be sure to know of to launch a logisland Docker environment by reading the prerequisites section
docker run -td –name kapua-sql -p 8181:8181 -p 3306:3306 kapua/kapua-sql:0.3.2 docker run -td –name kapua-elasticsearch -p 9200:9200 -p 9300:9300 elasticsearch:5.4.0 -Ecluster.name=kapua-datastore -Ediscovery.type=single-node -Etransport.host=_site_ -Etransport.ping_schedule=-1 -Etransport.tcp.connect_timeout=30s docker run -td –name kapua-broker –link kapua-sql:db –link kapua-elasticsearch:es –env commons.db.schema.update=true -p 1883:1883 -p 61614:61614 kapua/kapua-broker:0.3.2 docker run -td –name kapua-console –link kapua-sql:db –link kapua-broker:broker –link kapua-elasticsearch:es –env commons.db.schema.update=true -p 8080:8080 kapua/kapua-console:0.3.2 docker run -td –name kapua-api –link kapua-sql:db –link kapua-broker:broker –link kapua-elasticsearch:es –env commons.db.schema.update=true -p 8081:8080 kapua/kapua-api:0.3.2
docker run -td –name logisland-historian -p 8983:8983 hurence/chronix:latest
docker run -it –env MQTT_BROKER_URL=tcp://10.20.20.87:1883 –env SOLR_CONNECTION=http://10.20.20.87:8983/solr –name kapua-logisland hurence/logisland:0.12.0 bin/logisland.sh –conf conf/mqtt-to-historian.yml
Note, it is possible to store data in different datastores. In this tutorial, we will see the case of ElasticSearch and Solr.
1. Logisland job setup
The logisland job for this tutorial is already packaged in the tar.gz assembly and you can find it here for ElasticSearch :
docker exec -i -t logisland vim conf/index-apache-logs.yml
And here for Solr :
docker exec -i -t logisland vim conf/index-apache-logs-solr.yml
We will start by explaining each part of the config file.
An Engine is needed to handle the stream processing. This conf/index-apache-logs.yml configuration file defines a stream processing job setup.
The first section configures the Spark engine (we will use a KafkaStreamProcessingEngine) to run in local mode with 2 cpu cores and 2G of RAM.
engine:
  component: com.hurence.logisland.engine.spark.KafkaStreamProcessingEngine
  type: engine
  documentation: Index some apache logs with logisland
  configuration:
    spark.app.name: IndexApacheLogsDemo
    spark.master: local[2]
    spark.driver.memory: 1G
    spark.driver.cores: 1
    spark.executor.memory: 2G
    spark.executor.instances: 4
    spark.executor.cores: 2
    spark.yarn.queue: default
    spark.yarn.maxAppAttempts: 4
    spark.yarn.am.attemptFailuresValidityInterval: 1h
    spark.yarn.max.executor.failures: 20
    spark.yarn.executor.failuresValidityInterval: 1h
    spark.task.maxFailures: 8
    spark.serializer: org.apache.spark.serializer.KryoSerializer
    spark.streaming.batchDuration: 1000
    spark.streaming.backpressure.enabled: false
    spark.streaming.unpersist: false
    spark.streaming.blockInterval: 500
    spark.streaming.kafka.maxRatePerPartition: 3000
    spark.streaming.timeout: -1
    spark.streaming.unpersist: false
    spark.streaming.kafka.maxRetries: 3
    spark.streaming.ui.retainedBatches: 200
    spark.streaming.receiver.writeAheadLog.enable: false
    spark.ui.port: 4050
The controllerServiceConfigurations part is here to define all services that be shared by processors within the whole job, here an Elasticsearch service that will be used later in the BulkAddElasticsearch processor.
- controllerService: elasticsearch_service
  component: com.hurence.logisland.service.elasticsearch.Elasticsearch_5_4_0_ClientService
  type: service
  documentation: elasticsearch service
  configuration:
    hosts: sandbox:9300
    cluster.name: es-logisland
    batch.size: 5000
Inside this engine you will run a Kafka stream of processing, so we setup input/output topics and Kafka/Zookeeper hosts.
Here the stream will read all the logs sent in logisland_raw topic and push the processing output into logisland_events topic.
Note
We want to specify an Avro output schema to validate our ouput records (and force their types accordingly). It’s really for other streams to rely on a schema when processing records from a topic.
We can define some serializers to marshall all records from and to a topic.
- stream: parsing_stream
  component: com.hurence.logisland.stream.spark.KafkaRecordStreamParallelProcessing
  type: stream
  documentation: a processor that converts raw apache logs into structured log records
  configuration:
    kafka.input.topics: logisland_raw
    kafka.output.topics: logisland_events
    kafka.error.topics: logisland_errors
    kafka.input.topics.serializer: none
    kafka.output.topics.serializer: com.hurence.logisland.serializer.KryoSerializer
    kafka.error.topics.serializer: com.hurence.logisland.serializer.JsonSerializer
    kafka.metadata.broker.list: sandbox:9092
    kafka.zookeeper.quorum: sandbox:2181
    kafka.topic.autoCreate: true
    kafka.topic.default.partitions: 4
    kafka.topic.default.replicationFactor: 1
Within this stream a SplitText processor takes a log line as a String and computes a Record as a sequence of fields.
# parse apache logs
- processor: apache_parser
  component: com.hurence.logisland.processor.SplitText
  type: parser
  documentation: a parser that produce events from an apache log REGEX
  configuration:
    value.regex: (\S+)\s+(\S+)\s+(\S+)\s+\[([\w:\/]+\s[+\-]\d{4})\]\s+"(\S+)\s+(\S+)\s*(\S*)"\s+(\S+)\s+(\S+)
    value.fields: src_ip,identd,user,record_time,http_method,http_query,http_version,http_status,bytes_out
This stream will process log entries as soon as they will be queued into logisland_raw Kafka topics, each log will
be parsed as an event which will be pushed back to Kafka in the logisland_events topic.
The second processor will handle Records produced by the SplitText to index them into elasticsearch
# add to elasticsearch
- processor: es_publisher
  component: com.hurence.logisland.processor.elasticsearch.BulkAddElasticsearch
  type: processor
  documentation: a processor that trace the processed events
  configuration:
    elasticsearch.client.service: elasticsearch_service
    default.index: logisland
    default.type: event
    timebased.index: yesterday
    es.index.field: search_index
    es.type.field: record_type
Solr
In the case of Solr, we have to declare another service :
# Datastore service using Solr 6.6.2 - 5.5.5 also available
- controllerService: datastore_service
  component: com.hurence.logisland.service.solr.Solr_6_6_2_ClientService
  type: service
  documentation: "SolR 6.6.2 service"
  configuration:
    solr.cloud: false
    solr.connection.string: http://sandbox:8983/solr
    solr.collection: solr-apache-logs
    solr.concurrent.requests: 4
    flush.interval: 2000
    batch.size: 1000
With this configuration, Solr is used in standalone mode but you can also use the cloud mode by changing the corresponding config.
Note
You have to create the core/collection manually with the following fields : src_ip, identd, user, bytes_out,
http_method, http_version, http_query, http_status
Then, the second processor have to send data to Solr :
# all the parsed records are added to solr by bulk
- processor: solr_publisher
  component: com.hurence.logisland.processor.datastore.BulkPut
  type: processor
  documentation: "indexes processed events in SolR"
  configuration:
    datastore.client.service: datastore_service
2. Launch the script
For this tutorial we will handle some apache logs with a splitText parser and send them to Elastiscearch Connect a shell to your logisland container to launch the following streaming jobs.
For ElasticSearch :
docker exec -i -t logisland bin/logisland.sh --conf conf/index-apache-logs.yml
For Solr :
docker exec -i -t logisland bin/logisland.sh --conf conf/index-apache-logs-solr.yml
3. Inject some Apache logs into the system
Now we’re going to send some logs to logisland_raw Kafka topic.
We could setup a logstash or flume agent to load some apache logs into a kafka topic but there’s a super useful tool in the Kafka ecosystem : kafkacat, a generic command line non-JVM Apache Kafka producer and consumer which can be easily installed.
If you don’t have your own httpd logs available, you can use some freely available log files from NASA-HTTP web site access:
- Jul 01 to Jul 31, ASCII format, 20.7 MB gzip compressed
- Aug 04 to Aug 31, ASCII format, 21.8 MB gzip compressed
Let’s send the first 500000 lines of NASA http access over July 1995 to LogIsland with kafkacat to logisland_raw Kafka topic
cd /tmp
wget ftp://ita.ee.lbl.gov/traces/NASA_access_log_Jul95.gz
gunzip NASA_access_log_Jul95.gz
head -500000 NASA_access_log_Jul95 | kafkacat -b sandbox:9092 -t logisland_raw
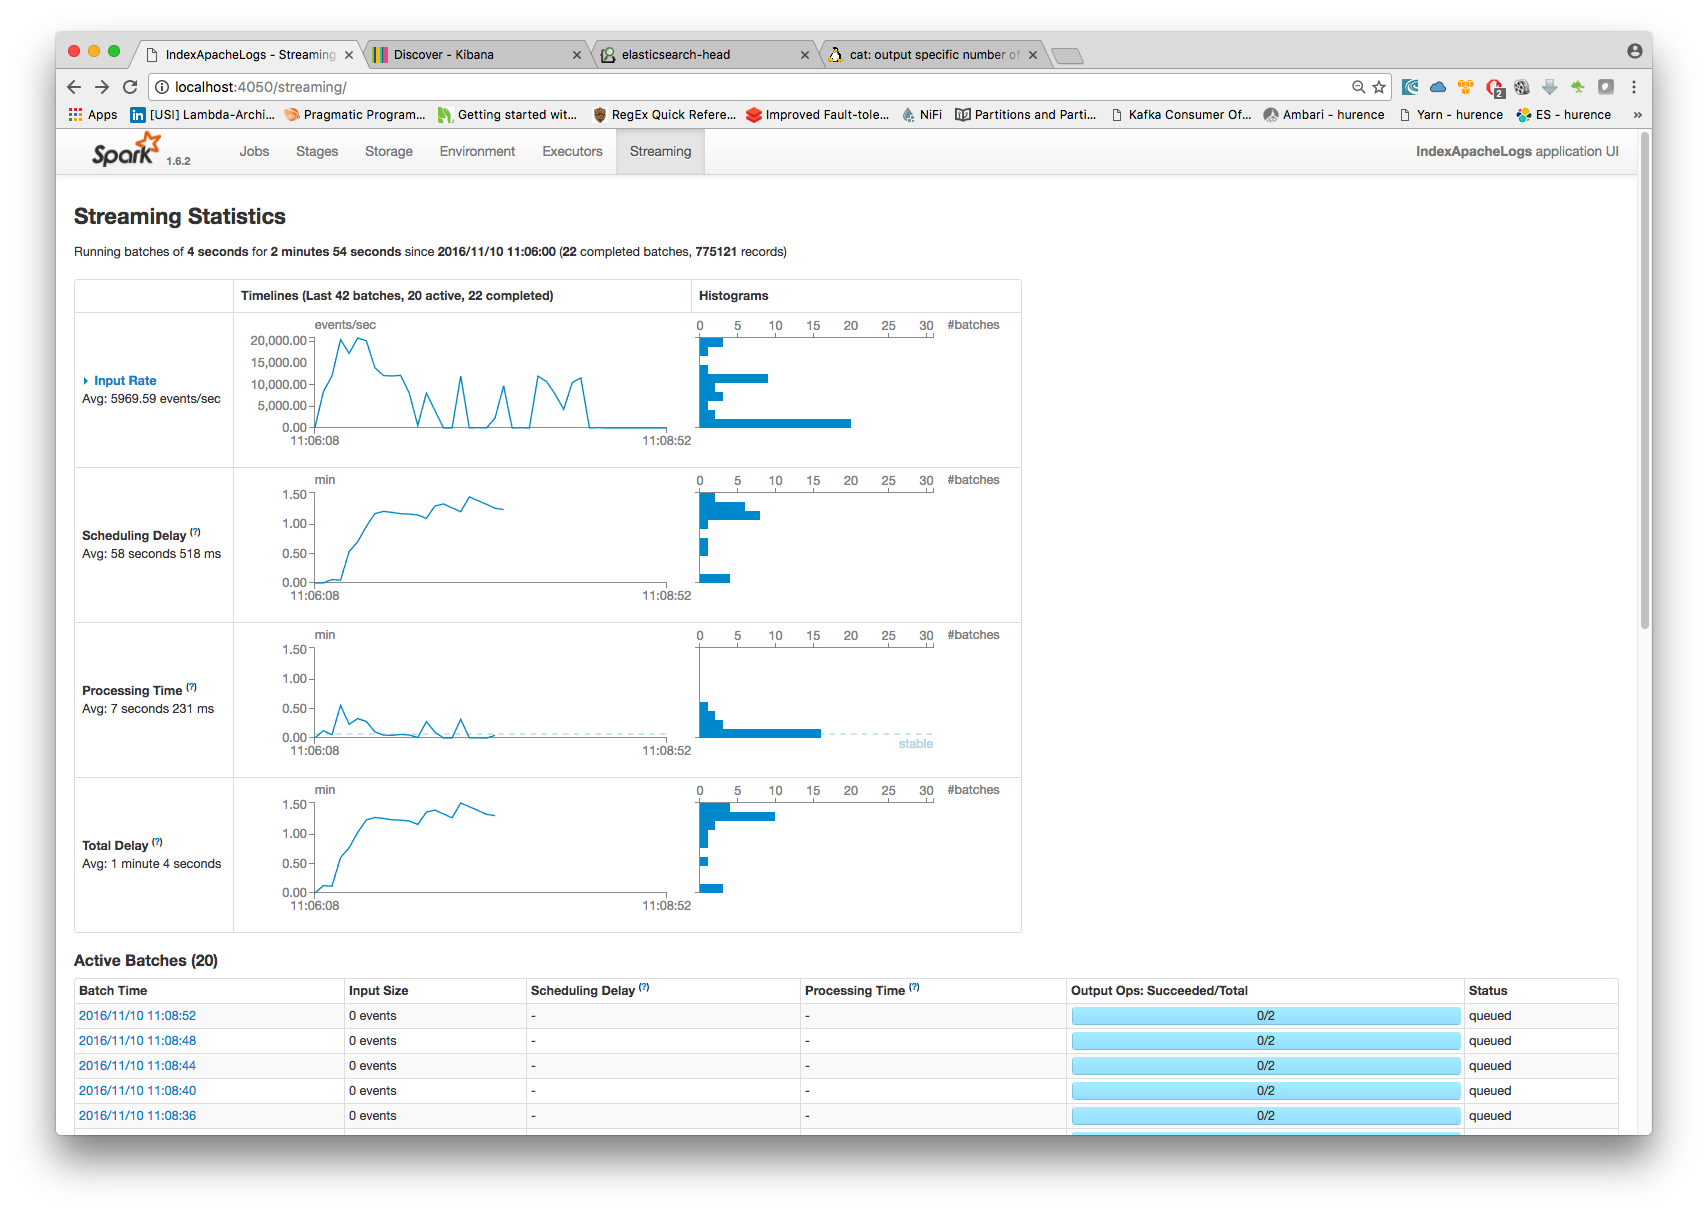
4. Monitor your spark jobs and Kafka topics
Now go to http://sandbox:4050/streaming/ to see how fast Spark can process your data
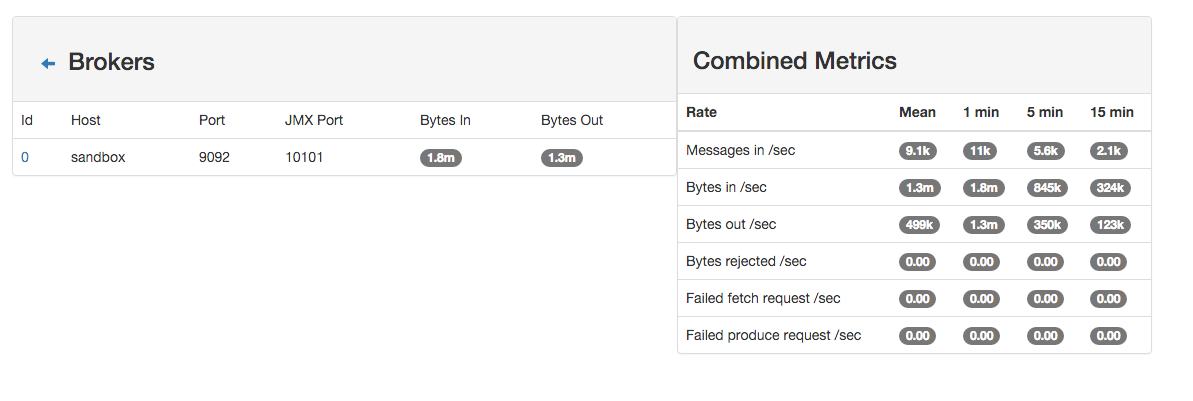
Another tool can help you to tweak and monitor your processing http://sandbox:9000/
5. Inspect the logs
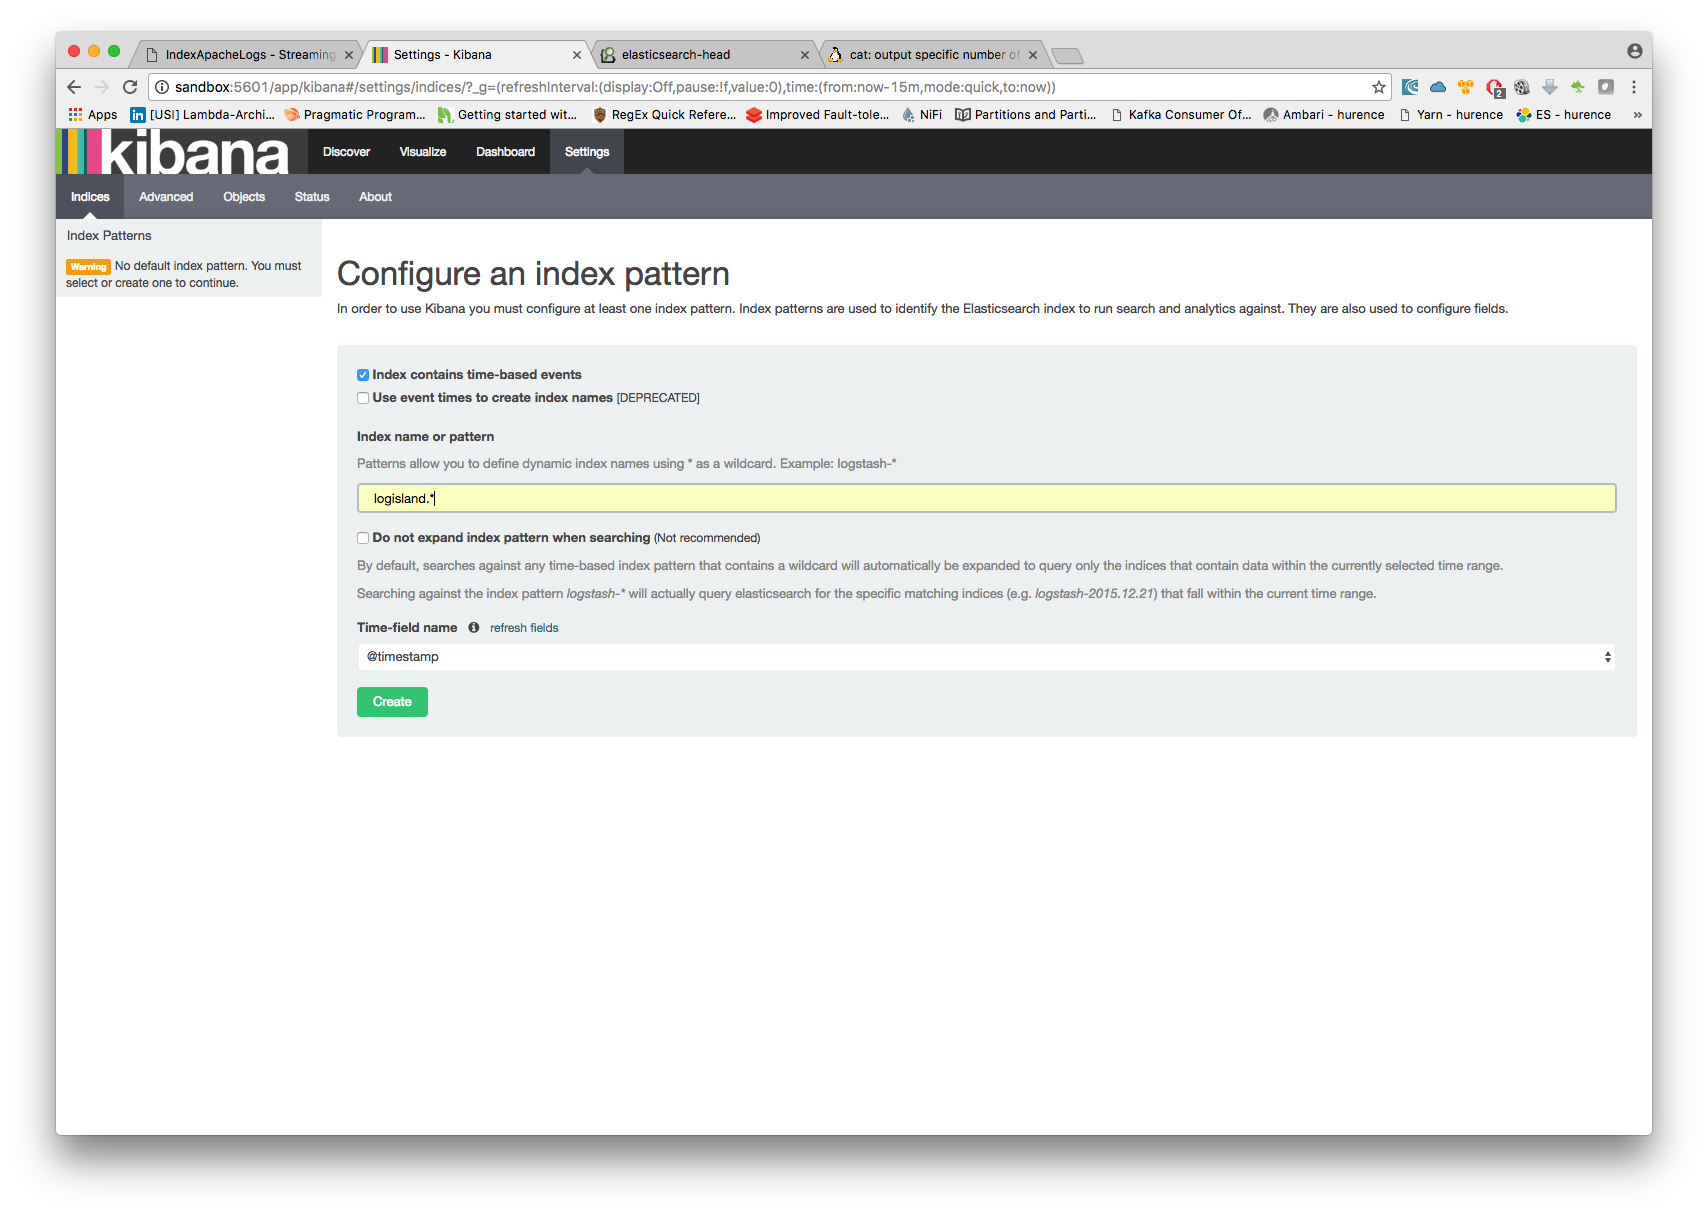
Kibana
With ElasticSearch, you can use Kibana.
Open up your browser and go to http://sandbox:5601/ and you should be able to explore your apache logs.
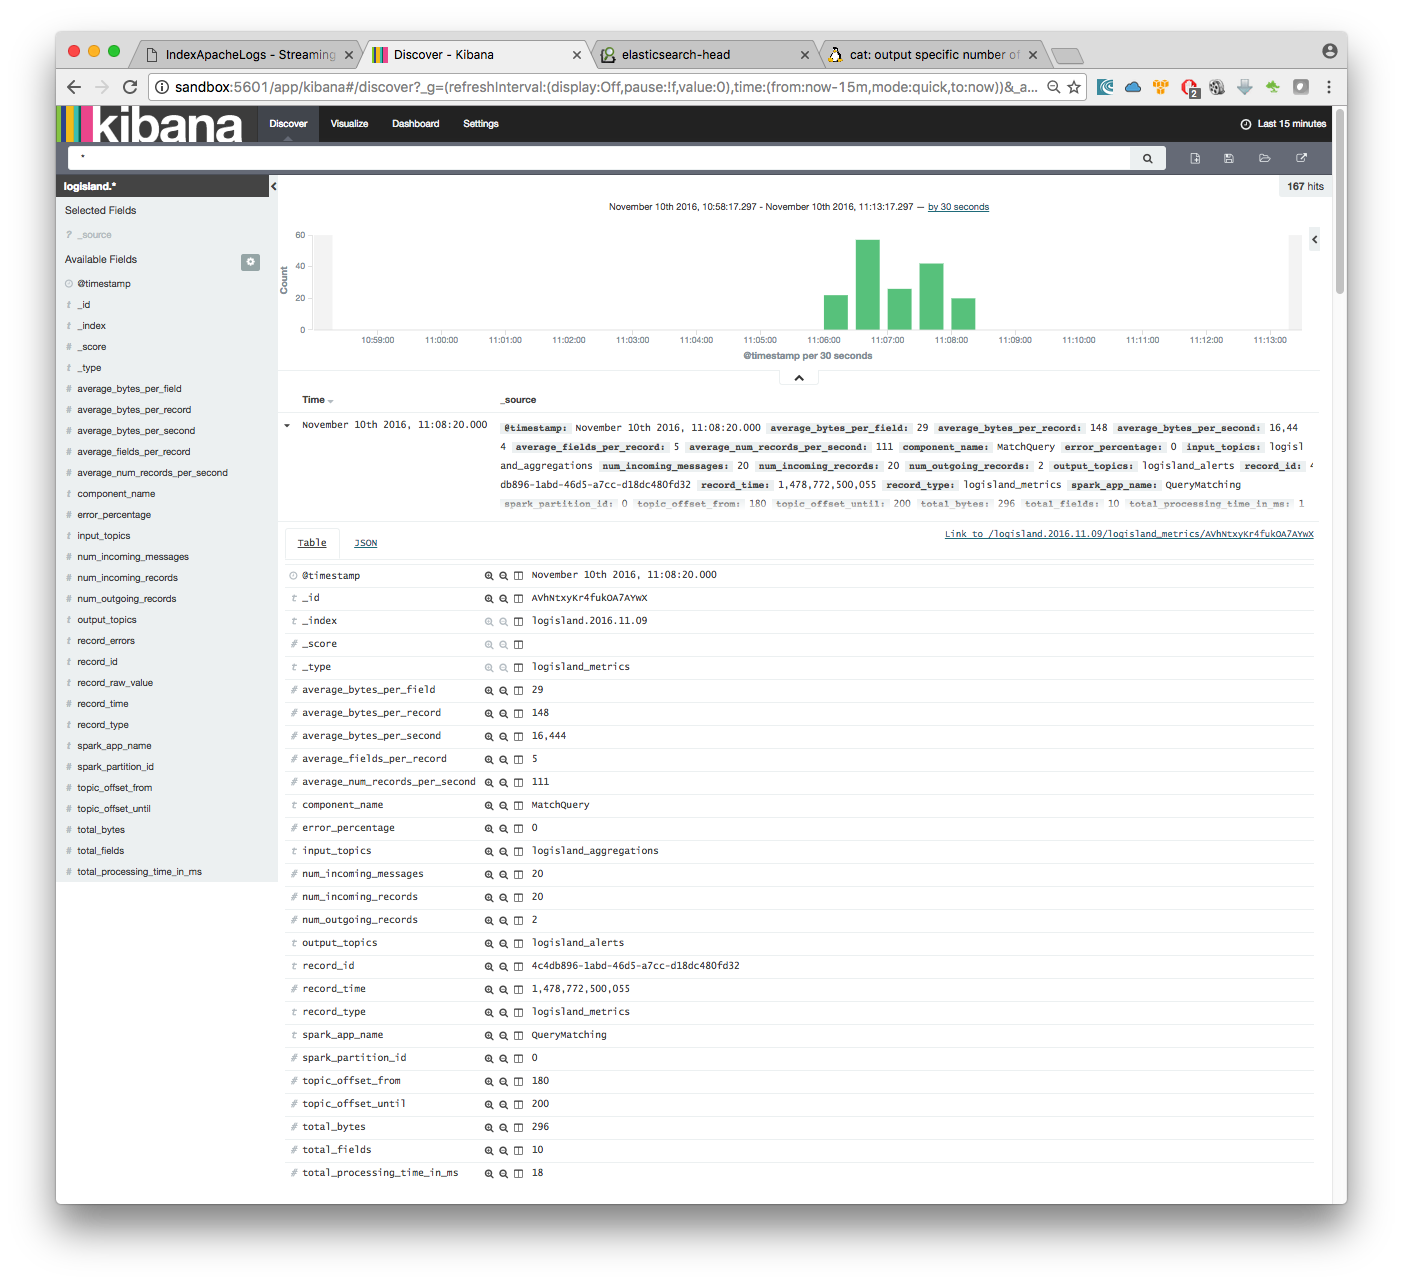
Configure a new index pattern with logisland.* as the pattern name and @timestamp as the time value field.
Then if you go to Explore panel for the latest 15’ time window you’ll only see logisland process_metrics events which give you insights about the processing bandwidth of your streams.
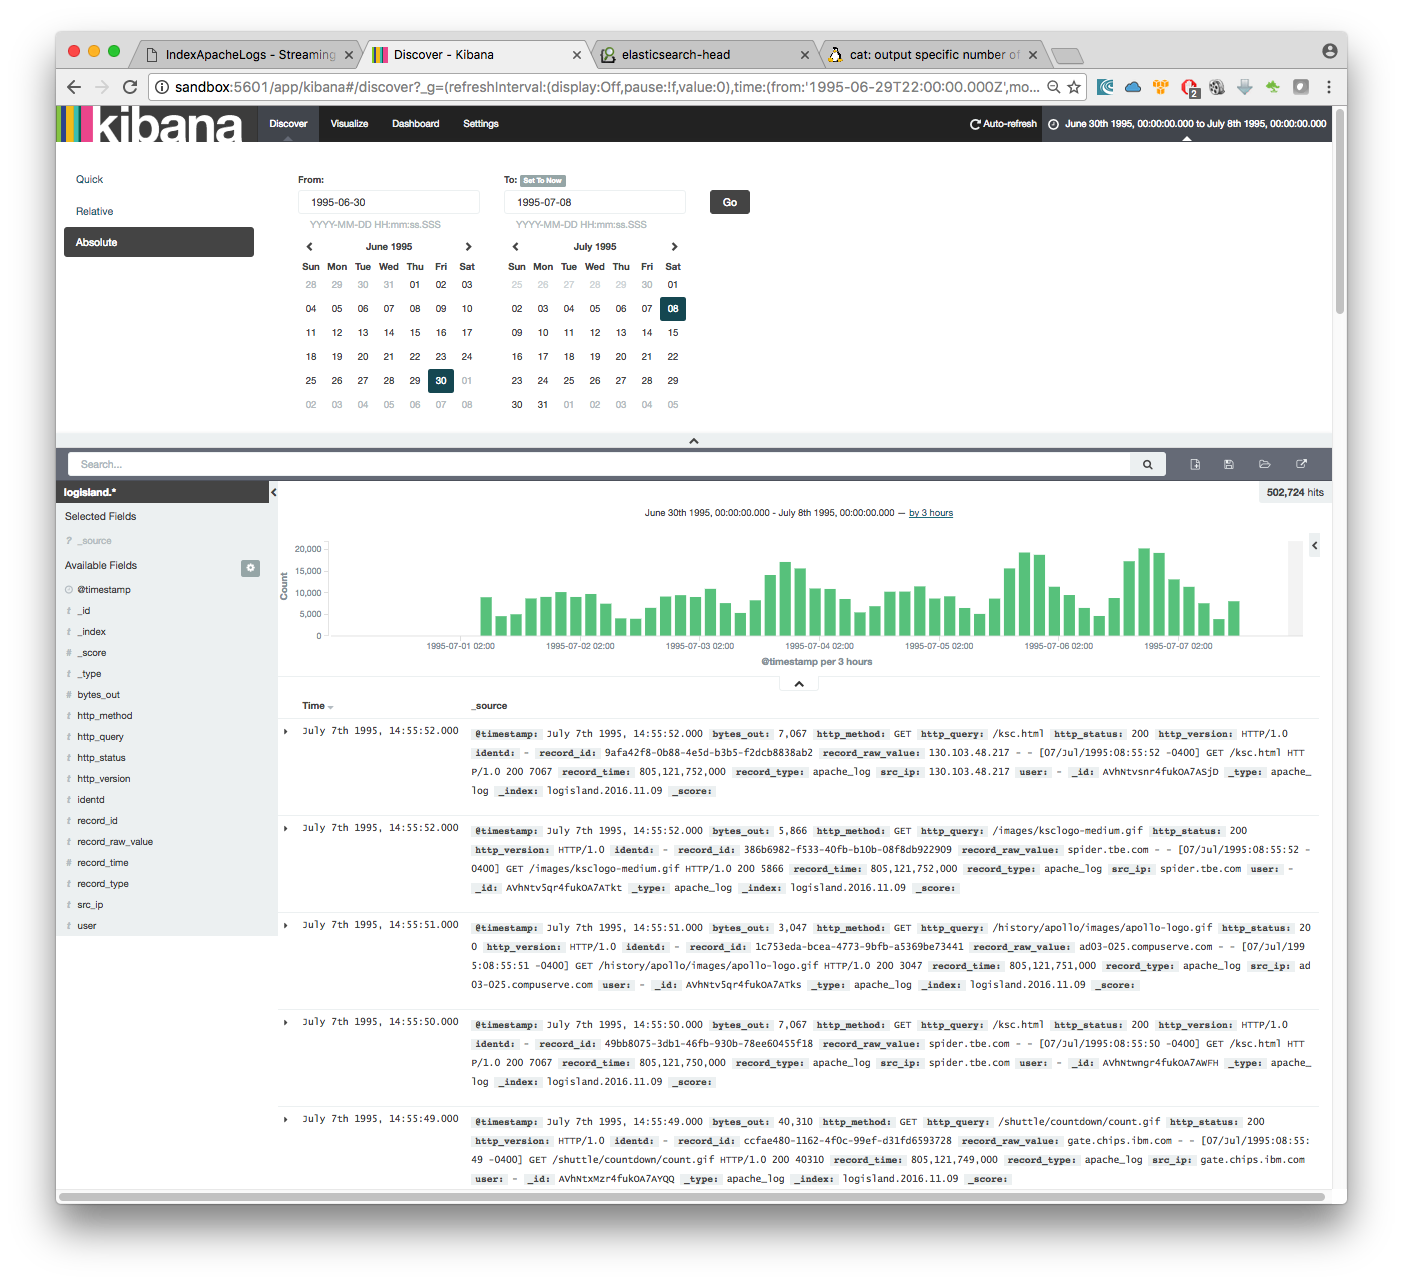
As we explore data logs from july 1995 we’ll have to select an absolute time filter from 1995-06-30 to 1995-07-08 to see the events.
Solr
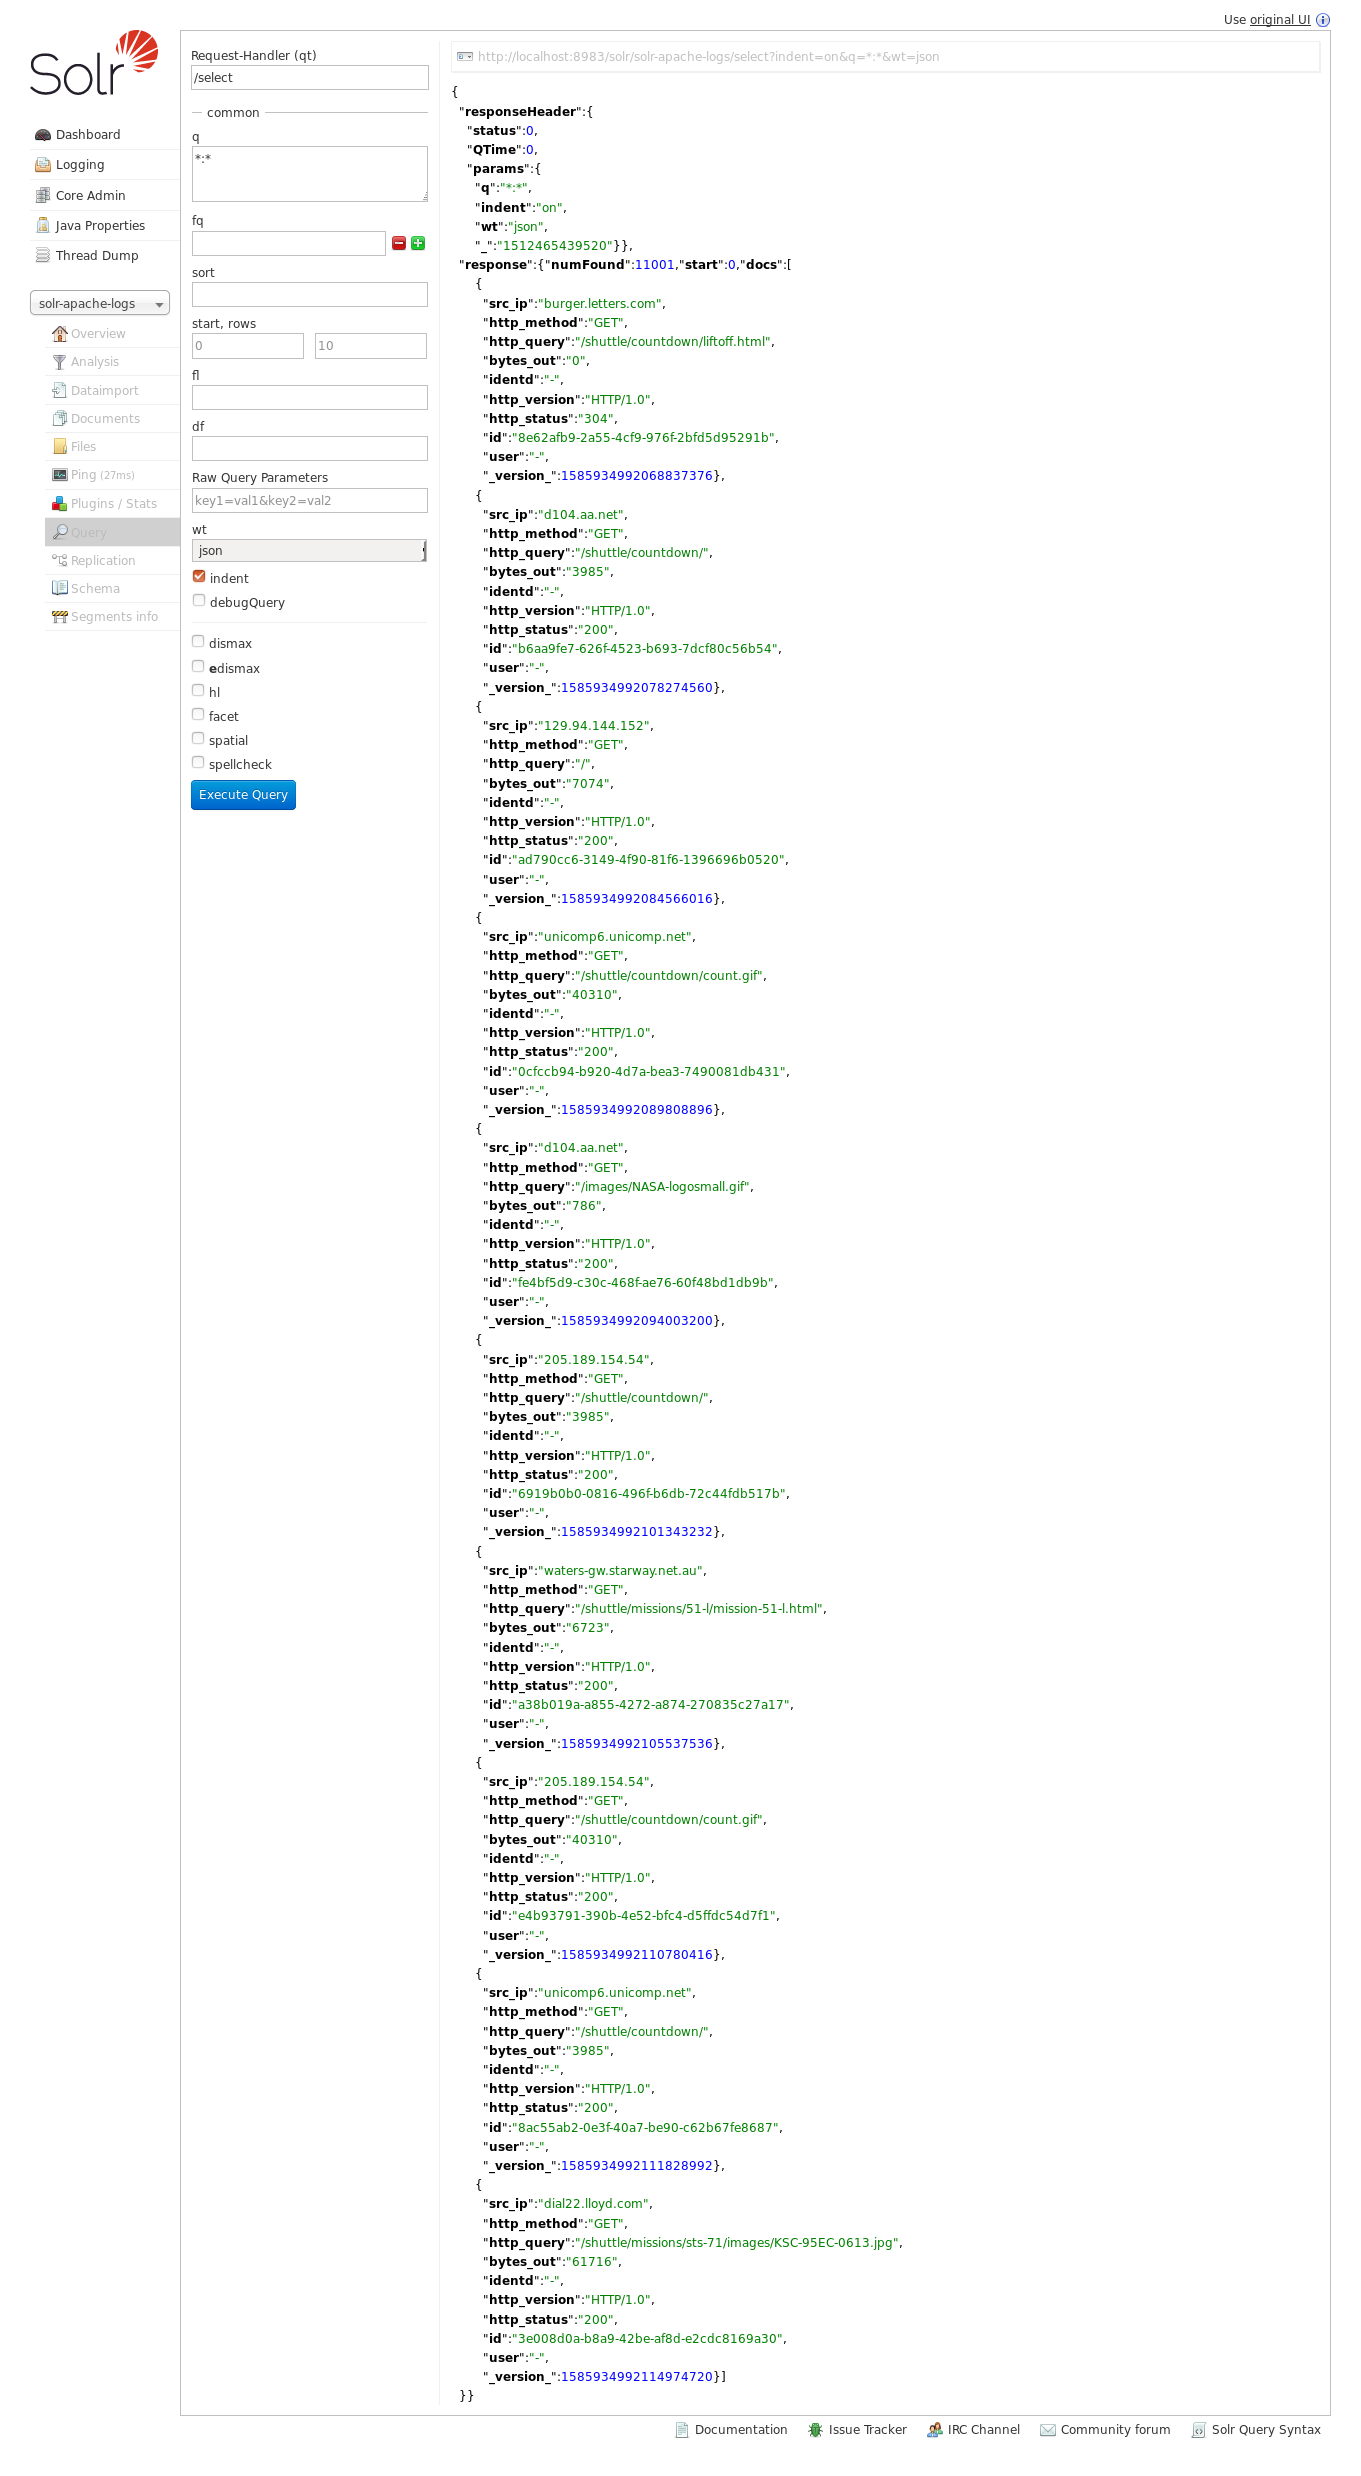
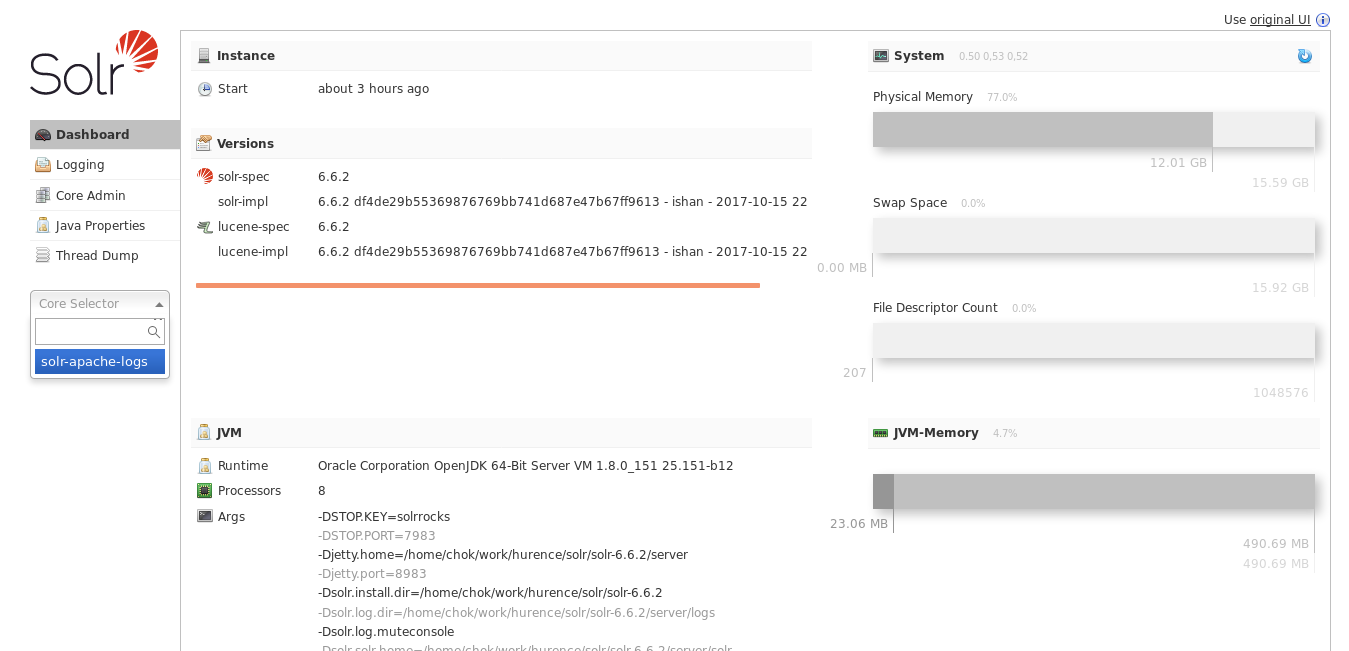
With Solr, you can directly use the solr web ui.
Open up your browser and go to http://sandbox:8983/solr and you should be able to view your apache logs.
In non cloud mode, use the core selector, to select the core `solr-apache-logs` :
Then, go to query and by clicking to Execute Query, you will see some data from your Apache logs :