Capturing Network packets in Logisland
1. Network Packets
A network packet is a formatted unit of data carried by a network from one computer (or device) to another. For example, a web page or an email are carried as a series of packets of a certain size in bytes. Each packet carries the information that will help it get to its destination : the sender’s IP address, the intended receiver’s IP address, something that tells the network how many packets the message has been broken into, …
Packet Headers
1. Protocol headers (IP, TCP, …)
This information is stored in different layers called “headers”, encapsulating the packet payload. For example, a TCP/IP packet is wrapped in a TCP header, which is in turn encapsulated in an IP header.
The individual packets for a given file or message may travel different routes through the Internet. When they have all arrived, they are reassembled by the TCP layer at the receiving end.
2. PCAP format specific headers
Packets can be either analysed in real-time (stream mode) or stored in files for upcoming analysis (batch mode). In the latter case, the packets are stored in the pcap format, adding some specific headers :
- a global header is added in the beginning of the pcap file
- a packet header is added in front of each packet
In this tutorial we are going to capture packets in live stream mode
Why capturing network packets ?
Packet sniffing, or packet analysis, is the process of capturing any data transmitted over the local network and searching for any information that may be useful for :
- Troubleshooting network problems
- Detecting network intrusion attempts
- Detecting network misuse by internal and external users
- Monitoring network bandwidth utilization
- Monitoring network and endpoint security status
- Gathering and report network statistics
Packets information collected by Logisland
LogIsland parses all the fields of IP protocol headers, namely :
1. IP Header fields
- IP version : ip_version
- Internet Header Length : ip_internet_header_length
- Type of Service : ip_type_of_service
- Datagram Total Length : ip_datagram_total_length
- Identification : ip_identification
- Flags : ip_flags
- Fragment offset : ip_fragment_offset
- Time To Live : ip_time_to_live
- Protocol : protocol
- Header Checksum : ip_checksum
- Source IP address : src_ip
- Destination IP address : dst_ip
- Options : ip_options (variable size)
- Padding : ip_padding (variable size)
2. TCP Header fields
- Source port number : src_port
- Destination port number : dest_port
- Sequence Number : tcp_sequence_number
- Acknowledgment Number : tcp_acknowledgment_number
- Data offset : tcp_data_offset
- Flags : tcp_flags
- Window size : tcp_window_size
- Checksum : tcp_checksum
- Urgent Pointer : tcp_urgent_pointer
- Options : tcp_options (variable size)
- Padding : tcp_padding (variable size)
3. UDP Header fields
- Source port number : src_port
- Destination port number : dest_port
- Segment total length : udp_segment_total_length
- Checksum : udp_checksum
2. Tutorial environment
This tutorial aims to show how to capture live Network Packets and process then in LogIsland. Through its out-of-the-box ParseNetworkPacket processor, LogIsland is able to receive and handle network packets captured by a packet sniffer tool. Using LogIsland, you will be able to inspect those packets for network security, optimization or monitoring reasons.
In this tutorial, we will show you how to capture network packets, process those packets in LogIsland, index them in ElasticSearch and then display them in Kibana.
We will launch two streaming processors, one for parsing Network Packets into LogIsland packet records, and one to index those packet records in ElasticSearch.
Packet Capture Tool
For the purpose of this tutorial, we are going to capture network packets (off-the-wire) into a kafka topic using pycapa Apache probe, a tool based on Pcapy, a Python extension module that interfaces with the libpcap packet capture library.
For information, it is also possible to use the fastcapa Apache probe, based on DPDK, intended for high-volume packet capture.
Note
You can download the latest release of LogIsland and the YAML configuration file for this tutorial which can be also found under $LOGISLAND_HOME/conf directory in the LogIsland container.
3. Start LogIsland as a Docker container
LogIsland is packaged as a Docker container that you can build yourself or pull from Docker Hub. The docker container is built from a Centos 6.4 image with the following tools enabled (among others)
- Kafka
- Spark
- Elasticsearch
- Kibana
- LogIsland
Pull the image from Docker Repository (it may take some time)
docker pull hurence/logisland
You should be aware that this Docker container is quite eager in RAM and will need at least 8G of memory to run smoothly. Now run the container
# run container
docker run \
    -it \
    -p 80:80 \
    -p 8080:8080 \
    -p 3000:3000 \
    -p 9200-9300:9200-9300 \
    -p 5601:5601 \
    -p 2181:2181 \
    -p 9092:9092 \
    -p 9000:9000 \
    -p 4050-4060:4050-4060 \
    --name logisland \
    -h sandbox \
    hurence/logisland bash

# get container ip
docker inspect logisland

# or if your are on mac os
docker-machine ip default
you should add an entry for sandbox (with the container ip) in your /etc/hosts as it will be easier to access to all web services in logisland running container.
Note
If you have your own Spark and Kafka cluster, you can download the latest release and unzip on an edge node.
4. Parse Network Packets
In this tutorial we will capture network packets, process those packets in LogIsland and index them in ElasticSearch.
Connect a shell to your logisland container to launch LogIsland streaming jobs :
docker exec -ti logisland bash
cd $LOGISLAND_HOME
bin/logisland.sh --conf conf/index-network-packets.yml
Setup Spark/Kafka streaming engine
An Engine is needed to handle the stream processing. This conf/index-network-packets.yml configuration file defines a stream processing job setup.
The first section configures the Spark engine, we will use a KafkaStreamProcessingEngine :
engine:
 component: com.hurence.logisland.engine.spark.KafkaStreamProcessingEngine
 type: engine
 documentation: Parse network packets with LogIsland
 configuration:
   spark.app.name: ParseNetworkPacketDemo
   spark.master: local[4]
   spark.driver.memory: 1G
   spark.driver.cores: 1
   spark.executor.memory: 2G
   spark.executor.instances: 4
   spark.executor.cores: 2
   spark.yarn.queue: default
   spark.yarn.maxAppAttempts: 4
   spark.yarn.am.attemptFailuresValidityInterval: 1h
   spark.yarn.max.executor.failures: 20
   spark.yarn.executor.failuresValidityInterval: 1h
   spark.task.maxFailures: 8
   spark.serializer: org.apache.spark.serializer.KryoSerializer
   spark.streaming.batchDuration: 4000
   spark.streaming.backpressure.enabled: false
   spark.streaming.unpersist: false
   spark.streaming.blockInterval: 500
   spark.streaming.kafka.maxRatePerPartition: 3000
   spark.streaming.timeout: -1
   spark.streaming.unpersist: false
   spark.streaming.kafka.maxRetries: 3
   spark.streaming.ui.retainedBatches: 200
   spark.streaming.receiver.writeAheadLog.enable: false
   spark.ui.port: 4050

 controllerServiceConfigurations:

   - controllerService: elasticsearch_service
     component: com.hurence.logisland.service.elasticsearch.Elasticsearch_2_4_0_ClientService
     type: service
     documentation: elasticsearch 2.4.0 service implementation
     configuration:
       hosts: sandbox:9300
       cluster.name: elasticsearch
       batch.size: 4000

 streamConfigurations:
Stream 1 : parse incoming Network Packets
Inside this engine you will run a Kafka stream of processing, so we setup input/output topics and Kafka/Zookeeper hosts.
Here the stream will read all the logs sent in logisland_input_packets_topic topic and push the processed packet records into logisland_parsed_packets_topic topic.
We can define some serializers to marshall all records from and to a topic.
# Parsing
- stream: parsing_stream
  component: com.hurence.logisland.stream.spark.KafkaRecordStreamParallelProcessing
  type: stream
  documentation: A processor chain that parses network packets into Logisland records
  configuration:
    kafka.input.topics: logisland_input_packets_topic
    kafka.output.topics: logisland_parsed_packets_topic
    kafka.error.topics: logisland_error_packets_topic
    kafka.input.topics.serializer: com.hurence.logisland.serializer.BytesArraySerializer
    kafka.output.topics.serializer: com.hurence.logisland.serializer.KryoSerializer
    kafka.error.topics.serializer: com.hurence.logisland.serializer.JsonSerializer
    kafka.metadata.broker.list: sandbox:9092
    kafka.zookeeper.quorum: sandbox:2181
    kafka.topic.autoCreate: true
    kafka.topic.default.partitions: 2
    kafka.topic.default.replicationFactor: 1
  processorConfigurations:
Within this stream there is a single processor in the processor chain: the ParseNetworkPacket processor. It takes an incoming network packet, parses it and computes a LogIsland record as a sequence of fields corresponding to packet headers fields.
# Transform network packets into LogIsland packet records
- processor: ParseNetworkPacket processor
  component: com.hurence.logisland.processor.networkpacket.ParseNetworkPacket
  type: parser
  documentation: A processor that parses network packets into LogIsland records
  configuration:
    debug: true
    flow.mode: stream
This stream will process network packets as soon as they will be queued into logisland_input_packets_topic Kafka topic, each packet will be parsed as a record which will be pushed back to Kafka in the logisland_parsed_packets_topic topic.
Stream 2: Index the processed records into Elasticsearch
The second Kafka stream will handle Records pushed into the logisland_parsed_packets_topic topic to index them into ElasticSearch. So there is no need to define an output topic:
# Indexing
- stream: indexing_stream
  component: com.hurence.logisland.stream.spark.KafkaRecordStreamParallelProcessing
  type: processor
  documentation: a processor that pushes events to ES
  configuration:
    kafka.input.topics: logisland_parsed_packets_topic
    kafka.output.topics: none
    kafka.error.topics: logisland_error_packets_topic
    kafka.input.topics.serializer: com.hurence.logisland.serializer.KryoSerializer
    kafka.output.topics.serializer: none
    kafka.error.topics.serializer: com.hurence.logisland.serializer.JsonSerializer
    kafka.metadata.broker.list: sandbox:9092
    kafka.zookeeper.quorum: sandbox:2181
    kafka.topic.autoCreate: true
    kafka.topic.default.partitions: 2
    kafka.topic.default.replicationFactor: 1
  processorConfigurations:
The only processor in the processor chain of this stream is the BulkAddElasticsearch processor.
# Bulk add into ElasticSearch
- processor: ES Publisher
  component: com.hurence.logisland.processor.elasticsearch.BulkAddElasticsearch
  type: processor
  documentation: A processor that pushes network packet records into ES
  configuration:
    elasticsearch.client.service: elasticsearch_service
    default.index: packets_index
    default.type: events
    timebased.index: today
    es.index.field: search_index
    es.type.field: record_type
The default.index: packets_index configuration parameter tells the elasticsearch processor to index records into an index starting with the packets_index string.
The timebased.index: today configuration parameter tells the processor to use the current date after the index prefix. Thus the index name is of the form /packets_index.2017.03.30.
Finally, the es.type.field: record_type configuration parameter tells the processor to use the
record field record_type of the incoming record to determine the ElasticSearch type to use within the index.
5. Stream network packets into the system
Let’s install and use the Apache pycapa probe to capture and send packets to kafka topics in real time.
Install pycapa probe
All required steps to install pycapa probe are explained in this site, but here are the main installation steps :
- Install libpcap, pip (python-pip) and python-devel :
yum install libpcap
yum install python-pip
yum install python-devel
- Build pycapa probe from Metron repo
cd /tmp
git clone https://github.com/apache/incubator-metron.git
cd incubator-metron/metron-sensors/pycapa
pip install -r requirements.txt
python setup.py install
Capture network packets
To start capturing network packets into the topic logisland_input_packets_topic using pycapa probe, use the following command :
pycapa --producer --kafka sandbox:9092 --topic logisland_input_packets_topic -i eth0
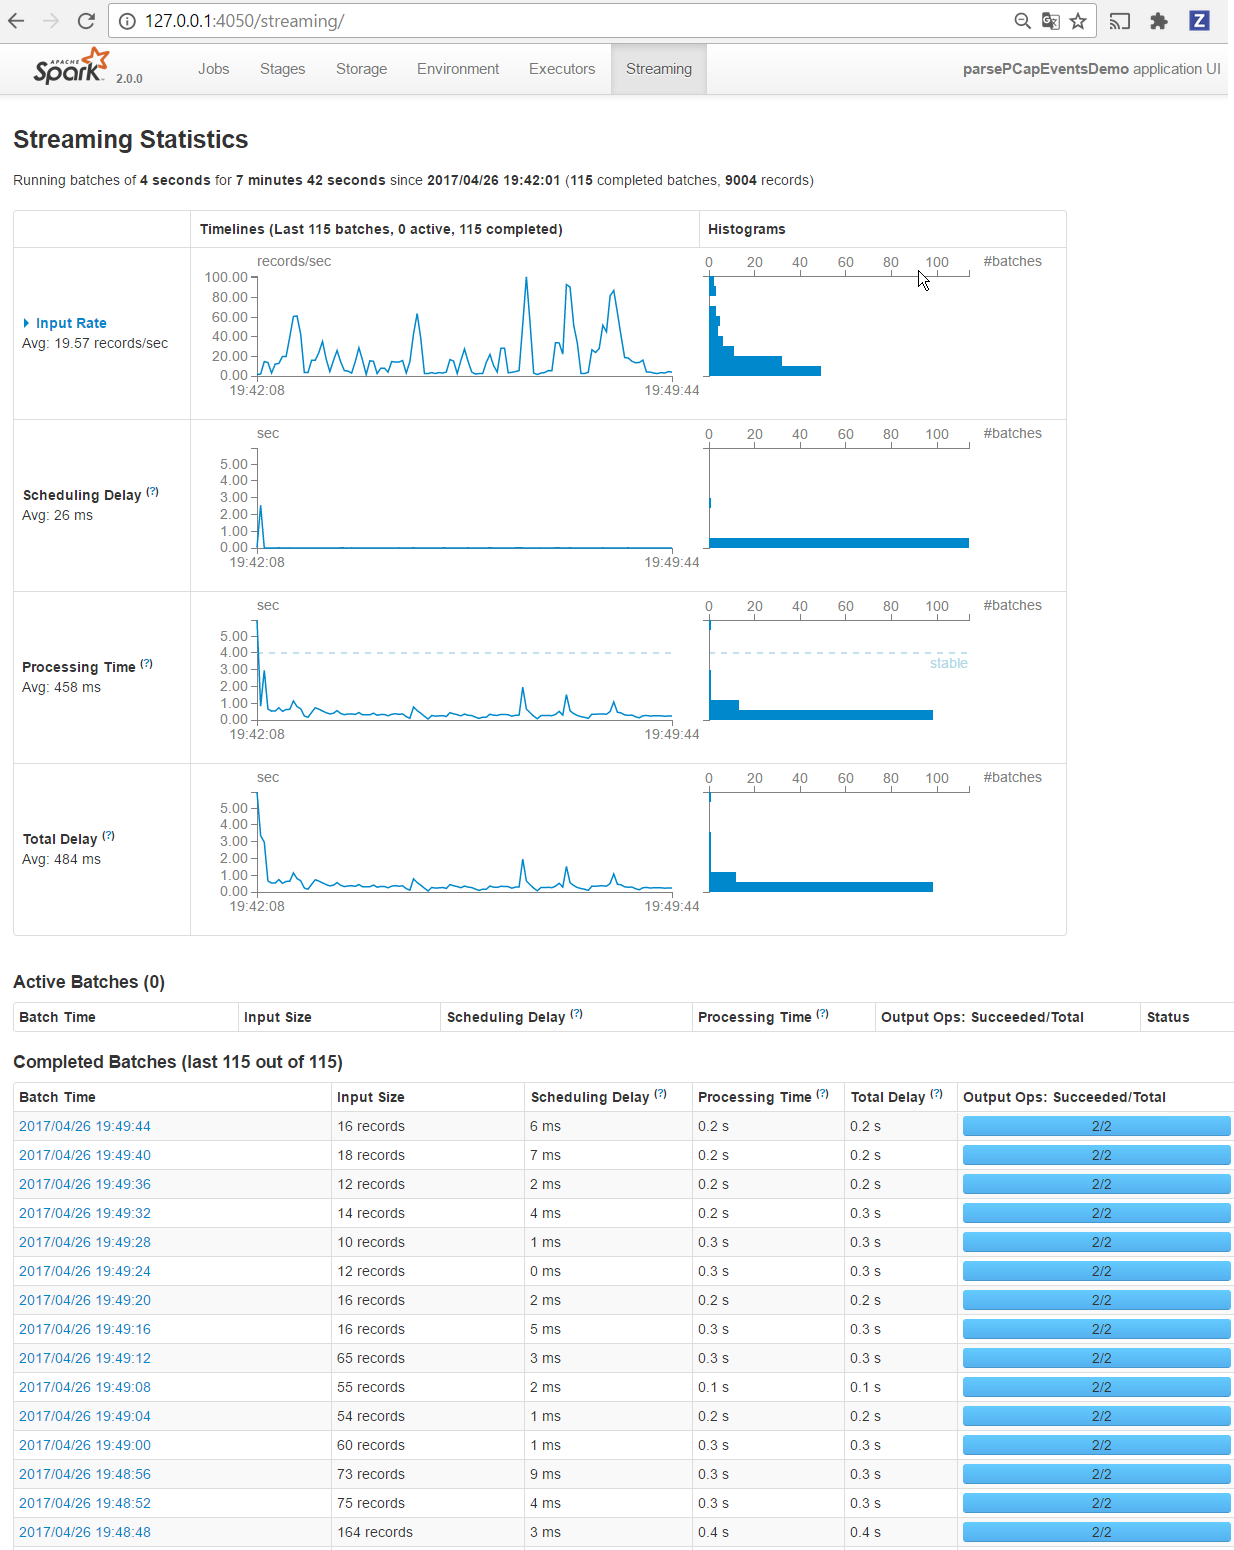
6. Monitor your spark jobs and Kafka topics
Now go to http://sandbox:4050/streaming/ to see how fast Spark can process your data
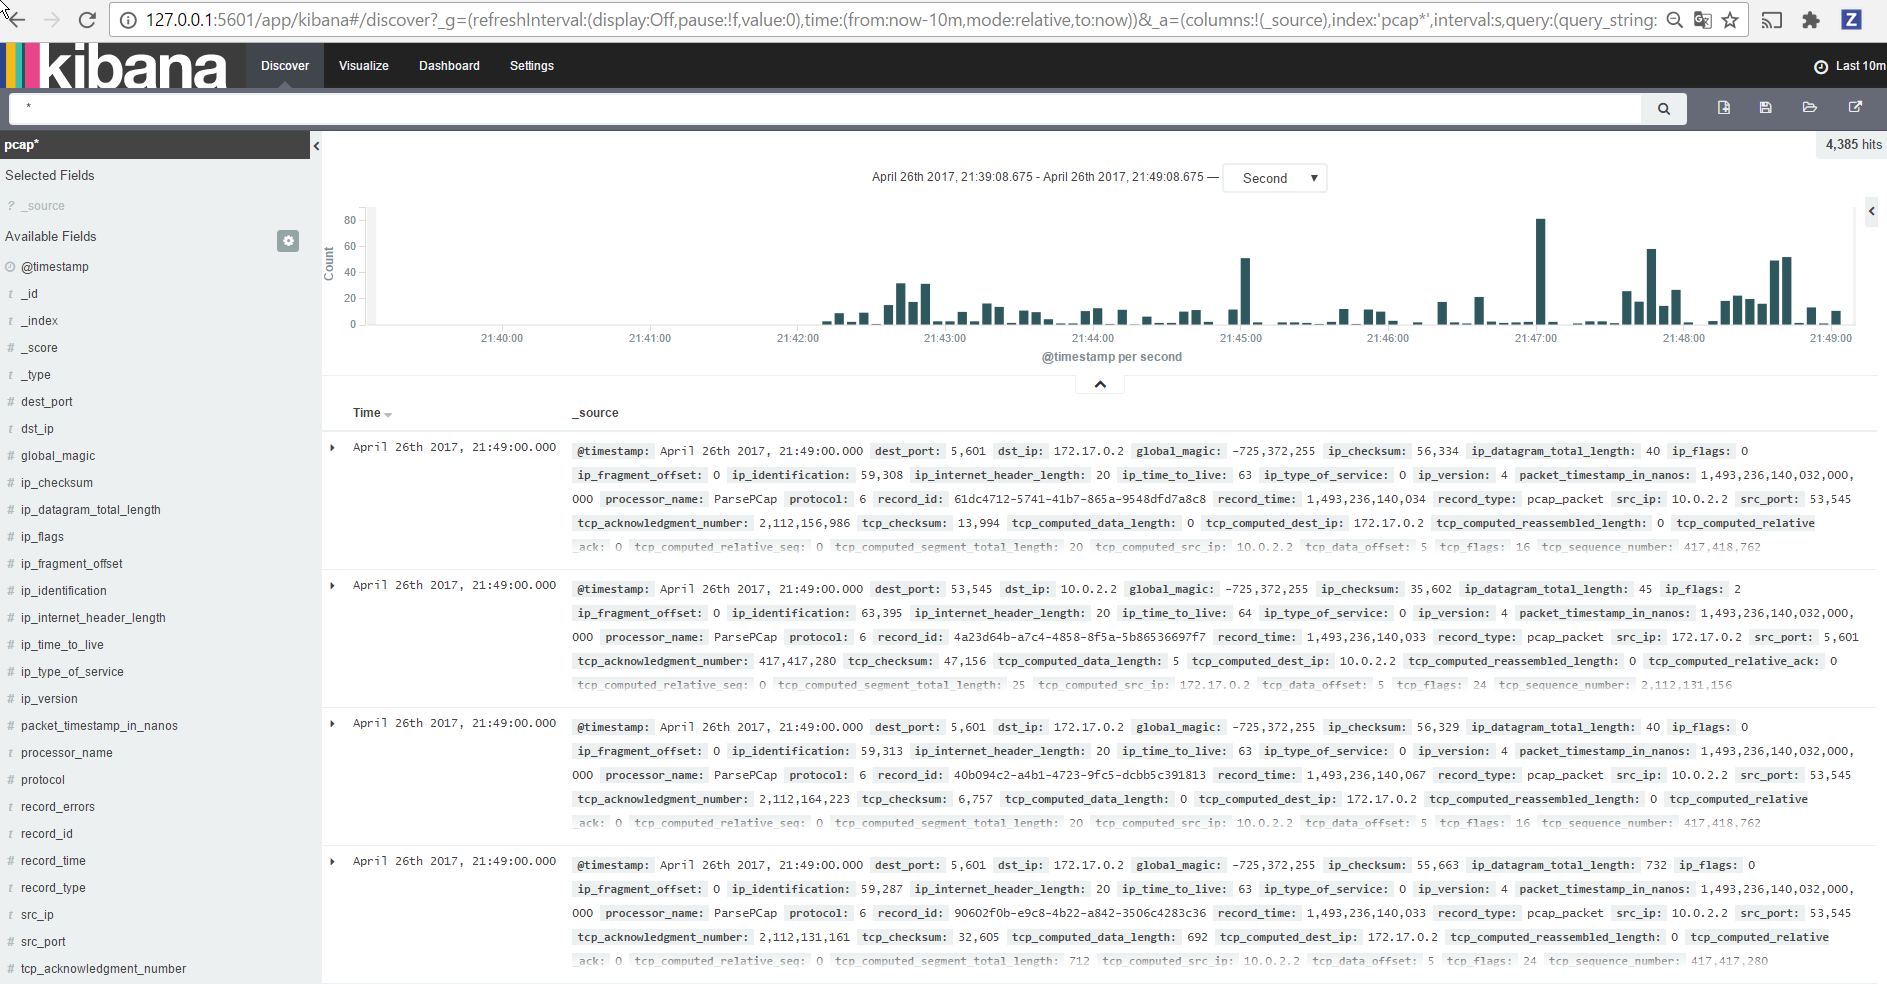
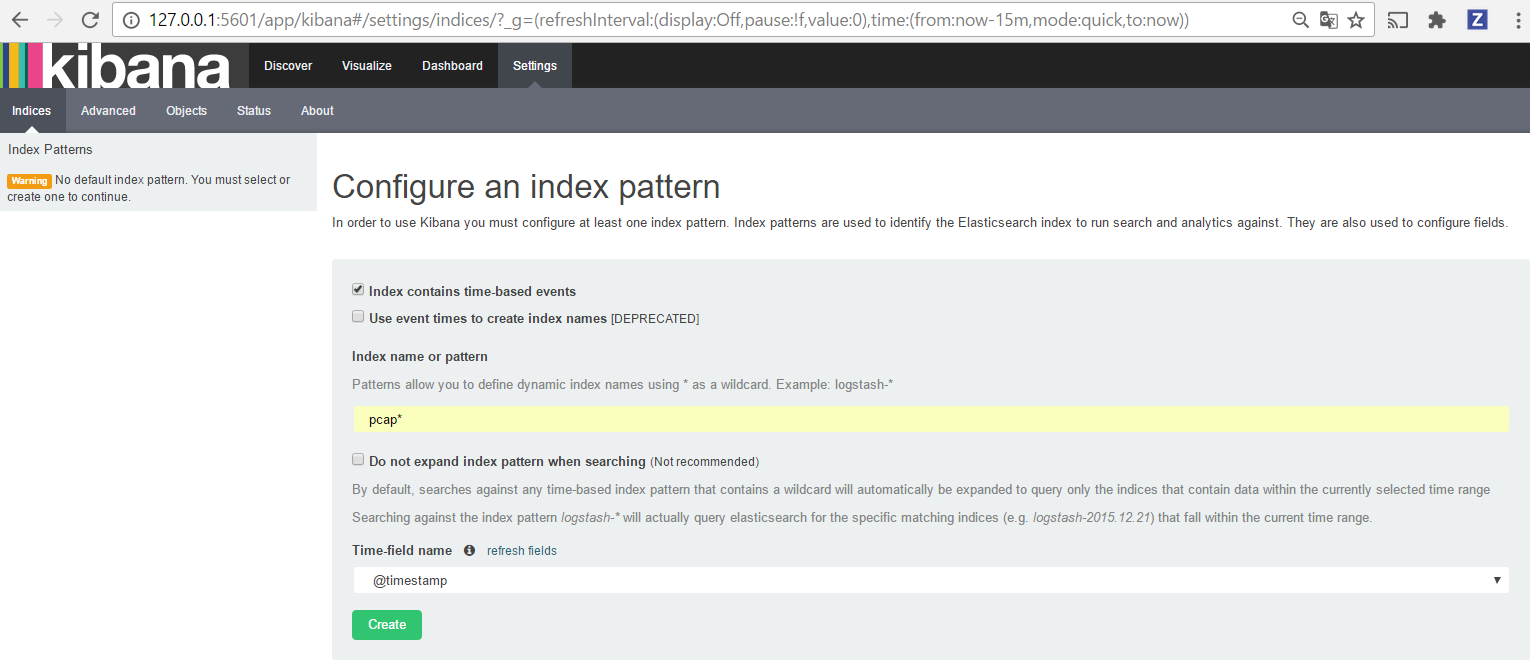
7. Use Kibana to inspect records
Inspect Network Packets under Discover tab
Open your browser and go to http://sandbox:5601/
Configure a new index pattern with packets.* as the pattern name and @timestamp as the time value field.
Then browse “Discover” tab, you should be able to explore your network packet records :