Index blockchain transactions
In the following getting started tutorial, we’ll explain you how to leverage logisland connectors flexibility in order process in real time every transaction emitted by the bitcoin blockchain platform and index each record into an elasticsearch platform.
This will allow us to run some dashboarding and visual data analysis as well.
Note
Be sure to know of to launch a logisland Docker environment by reading the prerequisites section
For kafka connect related information please follow as well the connectors section.
1. Logisland job setup
Install the blockchain connector if not already done.
bin/components.sh -i com.datamountaineer:kafka-connect-blockchain:1.1.1
The logisland job for this tutorial is already packaged in the tar.gz assembly and you can find it here for ElasticSearch :
vim conf/index-blockchain-transactions.yml
We will start by explaining each part of the config file.
The engine
The first section configures the Spark engine (we will use a KafkaStreamProcessingEngine) to run in local mode.
engine:
   component: com.hurence.logisland.engine.spark.KafkaStreamProcessingEngine
   type: engine
   documentation: Index some blockchain transactions with logisland
   configuration:
     spark.app.name: BlockchainTest
     spark.master: local[*]
     spark.driver.memory: 512M
     spark.driver.cores: 1
     spark.executor.memory: 512M
     spark.executor.instances: 4
     spark.executor.cores: 2
     spark.yarn.queue: default
     spark.yarn.maxAppAttempts: 4
     spark.yarn.am.attemptFailuresValidityInterval: 1h
     spark.yarn.max.executor.failures: 20
     spark.yarn.executor.failuresValidityInterval: 1h
     spark.task.maxFailures: 8
     spark.serializer: org.apache.spark.serializer.KryoSerializer
     spark.streaming.batchDuration: 2000
     spark.streaming.backpressure.enabled: false
     spark.streaming.blockInterval: 500
     spark.streaming.kafka.maxRatePerPartition: 10000
     spark.streaming.timeout: -1
     spark.streaming.unpersist: false
     spark.streaming.kafka.maxRetries: 3
     spark.streaming.ui.retainedBatches: 200
     spark.streaming.receiver.writeAheadLog.enable: false
     spark.ui.port: 4040

 The `controllerServiceConfigurations` part is here to define all services that be shared by processors within the whole job.

 ==================
 The parsing stream
 ==================

 Here we are going to use a special processor (``KafkaConnectStructuredSourceProviderService``) to use the kafka connect source as input for the structured stream defined below.

 For this example, we are going to use the source *com.datamountaineer.streamreactor.connect.blockchain.source.BlockchainSourceConnector*
 that opens a secure websocket connections to the blockchain subscribing to any transaction update stream.


 .. code-block:: yaml

     ControllerServiceConfigurations:
     - controllerService: kc_source_service
       component: com.hurence.logisland.stream.spark.provider.KafkaConnectStructuredSourceProviderService
       configuration:
         kc.data.value.converter: com.hurence.logisland.connect.converter.LogIslandRecordConverter
         kc.data.value.converter.properties: |
           record.serializer=com.hurence.logisland.serializer.KryoSerializer
         kc.data.key.converter.properties: |
           schemas.enable=false
         kc.data.key.converter: org.apache.kafka.connect.storage.StringConverter
         kc.worker.tasks.max: 1
         kc.connector.class: com.datamountaineer.streamreactor.connect.blockchain.source.BlockchainSourceConnector
         kc.connector.offset.backing.store: memory
         kc.connector.properties: |
           connect.blockchain.source.url=wss://ws.blockchain.info/inv
           connect.blockchain.source.kafka.topic=blockchain
Note
Our source is providing structured value hence we convert with LogInslandRecordConverter serializing with Kryo
# Kafka sink configuration
- controllerService: kafka_out_service
  component: com.hurence.logisland.stream.spark.structured.provider.KafkaStructuredStreamProviderService
  configuration:
    kafka.output.topics: logisland_raw
    kafka.error.topics: logisland_errors
    kafka.input.topics.serializer: com.hurence.logisland.serializer.KryoSerializer
    kafka.output.topics.serializer: com.hurence.logisland.serializer.KryoSerializer
    kafka.error.topics.serializer: com.hurence.logisland.serializer.JsonSerializer
    kafka.metadata.broker.list: sandbox:9092
    kafka.zookeeper.quorum: sandbox:2181
    kafka.topic.autoCreate: true
    kafka.topic.default.partitions: 4
    kafka.topic.default.replicationFactor: 1
So that, we can now define the parsing stream using those source and sink
######### parsing stream ##############
- stream: parsing_stream_source
  component: com.hurence.logisland.stream.spark.structured.StructuredStream
  documentation: "Takes records from the kafka source and distributes related partitions over a kafka topic. Records are then handed off to the indexing stream"
  configuration:
    read.topics: /a/in
    read.topics.serializer: com.hurence.logisland.serializer.KryoSerializer
    read.topics.key.serializer: com.hurence.logisland.serializer.KryoSerializer
    read.topics.client.service: kc_source_service
    write.topics: logisland_raw
    write.topics.serializer: com.hurence.logisland.serializer.KryoSerializer
    write.topics.key.serializer: com.hurence.logisland.serializer.KryoSerializer
    write.topics.client.service: kafka_out_service
Within this stream, a FlatMap processor takes out the value and key (required when using StructuredStream as source of records)
processorConfigurations:
 - processor: flatten
   component: com.hurence.logisland.processor.FlatMap
   type: processor
   documentation: "Takes out data from record_value"
   configuration:
     keep.root.record: false
     copy.root.record.fields: true
The indexing stream
Inside this engine, you will run a Kafka stream of processing, so we set up input/output topics and Kafka/Zookeeper hosts.
Here the stream will read all the logs sent in logisland_raw topic and push the processing output into logisland_events topic.
Note
We want to specify an Avro output schema to validate our output records (and force their types accordingly). It’s really for other streams to rely on a schema when processing records from a topic.
We can define some serializers to marshall all records from and to a topic.
- stream: parsing_stream_source
  component: com.hurence.logisland.stream.spark.structured.StructuredStream
  documentation: "Takes records from the kafka source and distributes related partitions over a kafka topic. Records are then handed off to the indexing stream"
  configuration:
    read.topics: /a/in
    read.topics.serializer: com.hurence.logisland.serializer.KryoSerializer
    read.topics.key.serializer: com.hurence.logisland.serializer.KryoSerializer
    read.topics.client.service: kc_source_service
    write.topics: logisland_raw
    write.topics.serializer: com.hurence.logisland.serializer.KryoSerializer
    write.topics.key.serializer: com.hurence.logisland.serializer.KryoSerializer
    write.topics.client.service: kafka_out_service
Within this stream, a BulkAddElasticsearch takes care of indexing a Record sending it to elasticsearch.
-  processor: es_publisher
   component: com.hurence.logisland.processor.elasticsearch.BulkAddElasticsearch
   type: processor
   documentation: a processor that indexes processed events in elasticsearch
   configuration:
     elasticsearch.client.service: elasticsearch_service
     default.index: logisland
     default.type: event
     timebased.index: yesterday
     es.index.field: search_index
     es.type.field: record_type
In details, this processor makes use of a Elasticsearch_5_4_0_ClientService controller service to interact with our Elasticsearch 5.X backend
running locally (and started as part of the docker compose configuration we mentioned above).
Here below its configuration:
- controllerService: elasticsearch_service
  component: com.hurence.logisland.service.elasticsearch.Elasticsearch_5_4_0_ClientService
  type: service
  documentation: elasticsearch service
  configuration:
    hosts: sandbox:9300
    cluster.name: es-logisland
    batch.size: 5000
2. Launch the script
Connect a shell to your logisland container to launch the following streaming jobs.
bin/logisland.sh --conf conf/index-blockchain-transactions.yml
3. Do some insights and visualizations
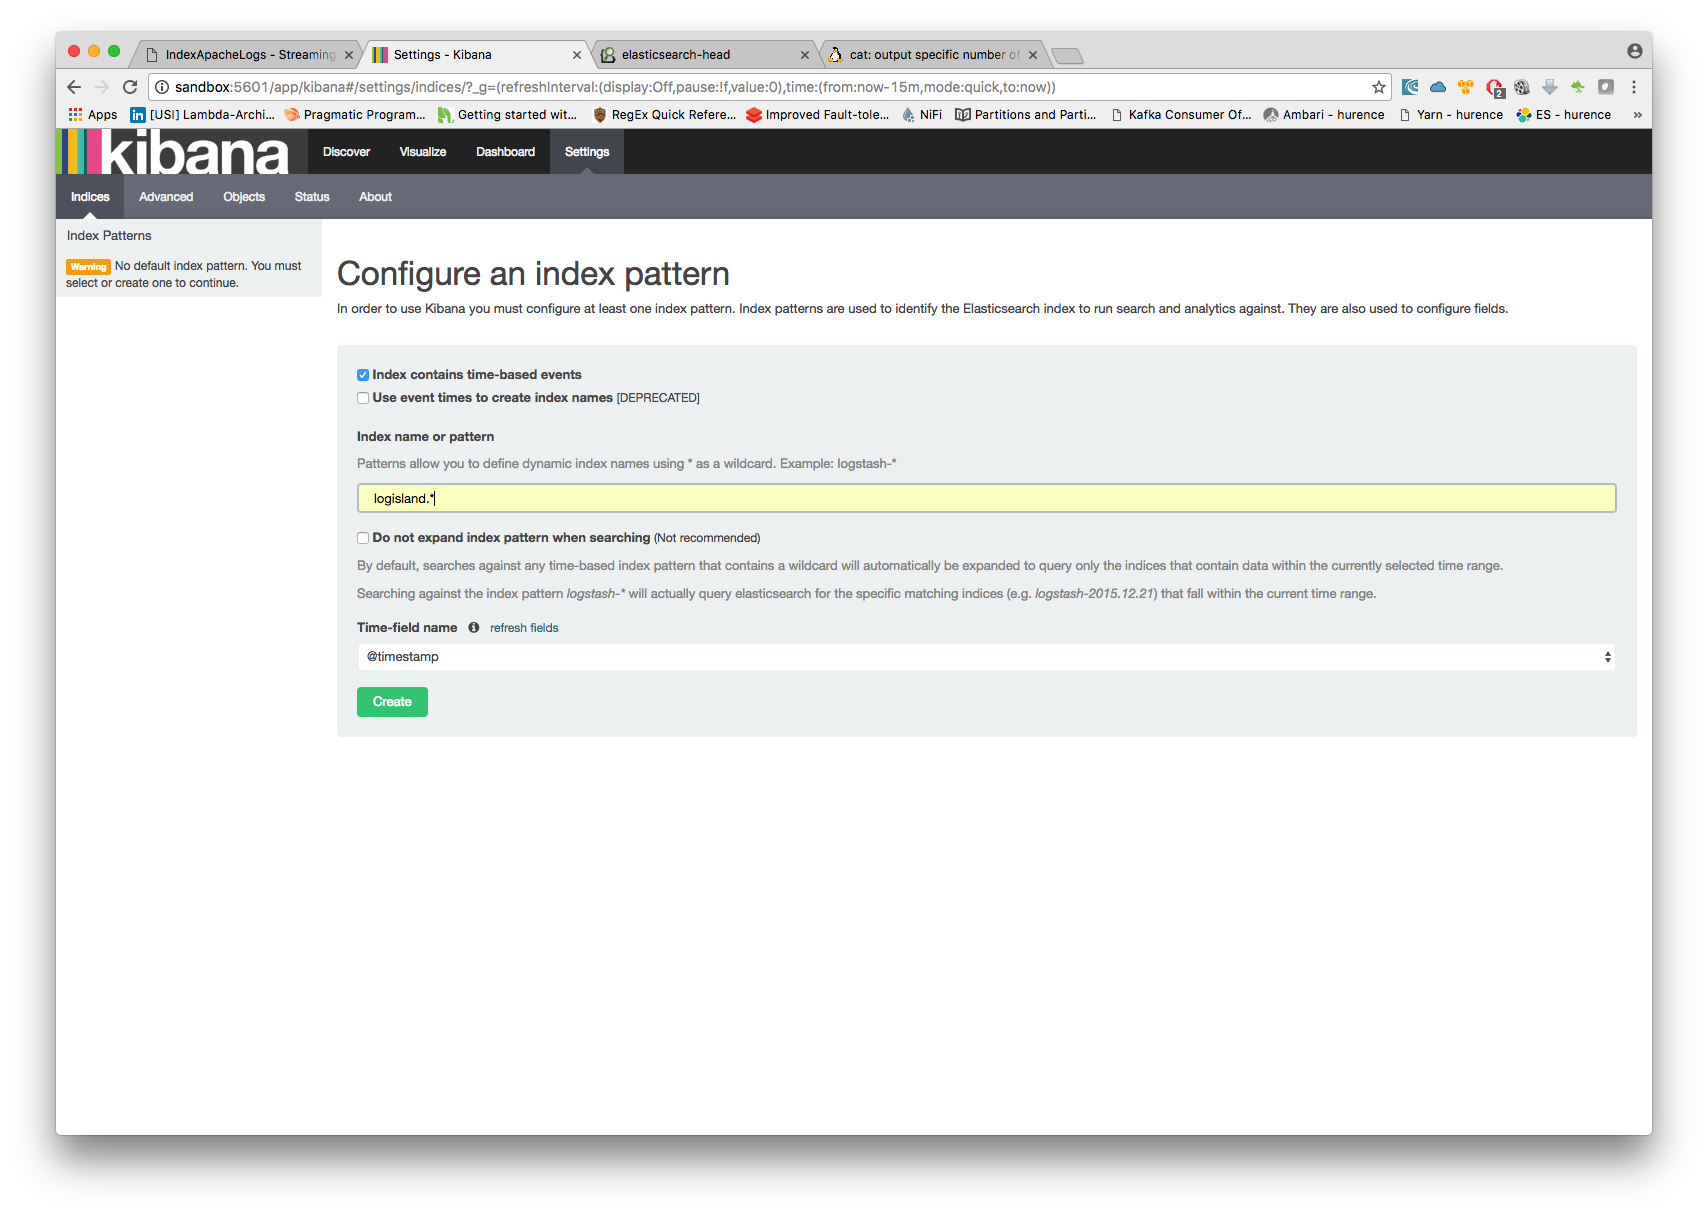
With ElasticSearch, you can use Kibana.
Open up your browser and go to http://sandbox:5601/app/kibana#/ and you should be able to explore the blockchain transactions.
Configure a new index pattern with logisland.* as the pattern name and @timestamp as the time value field.
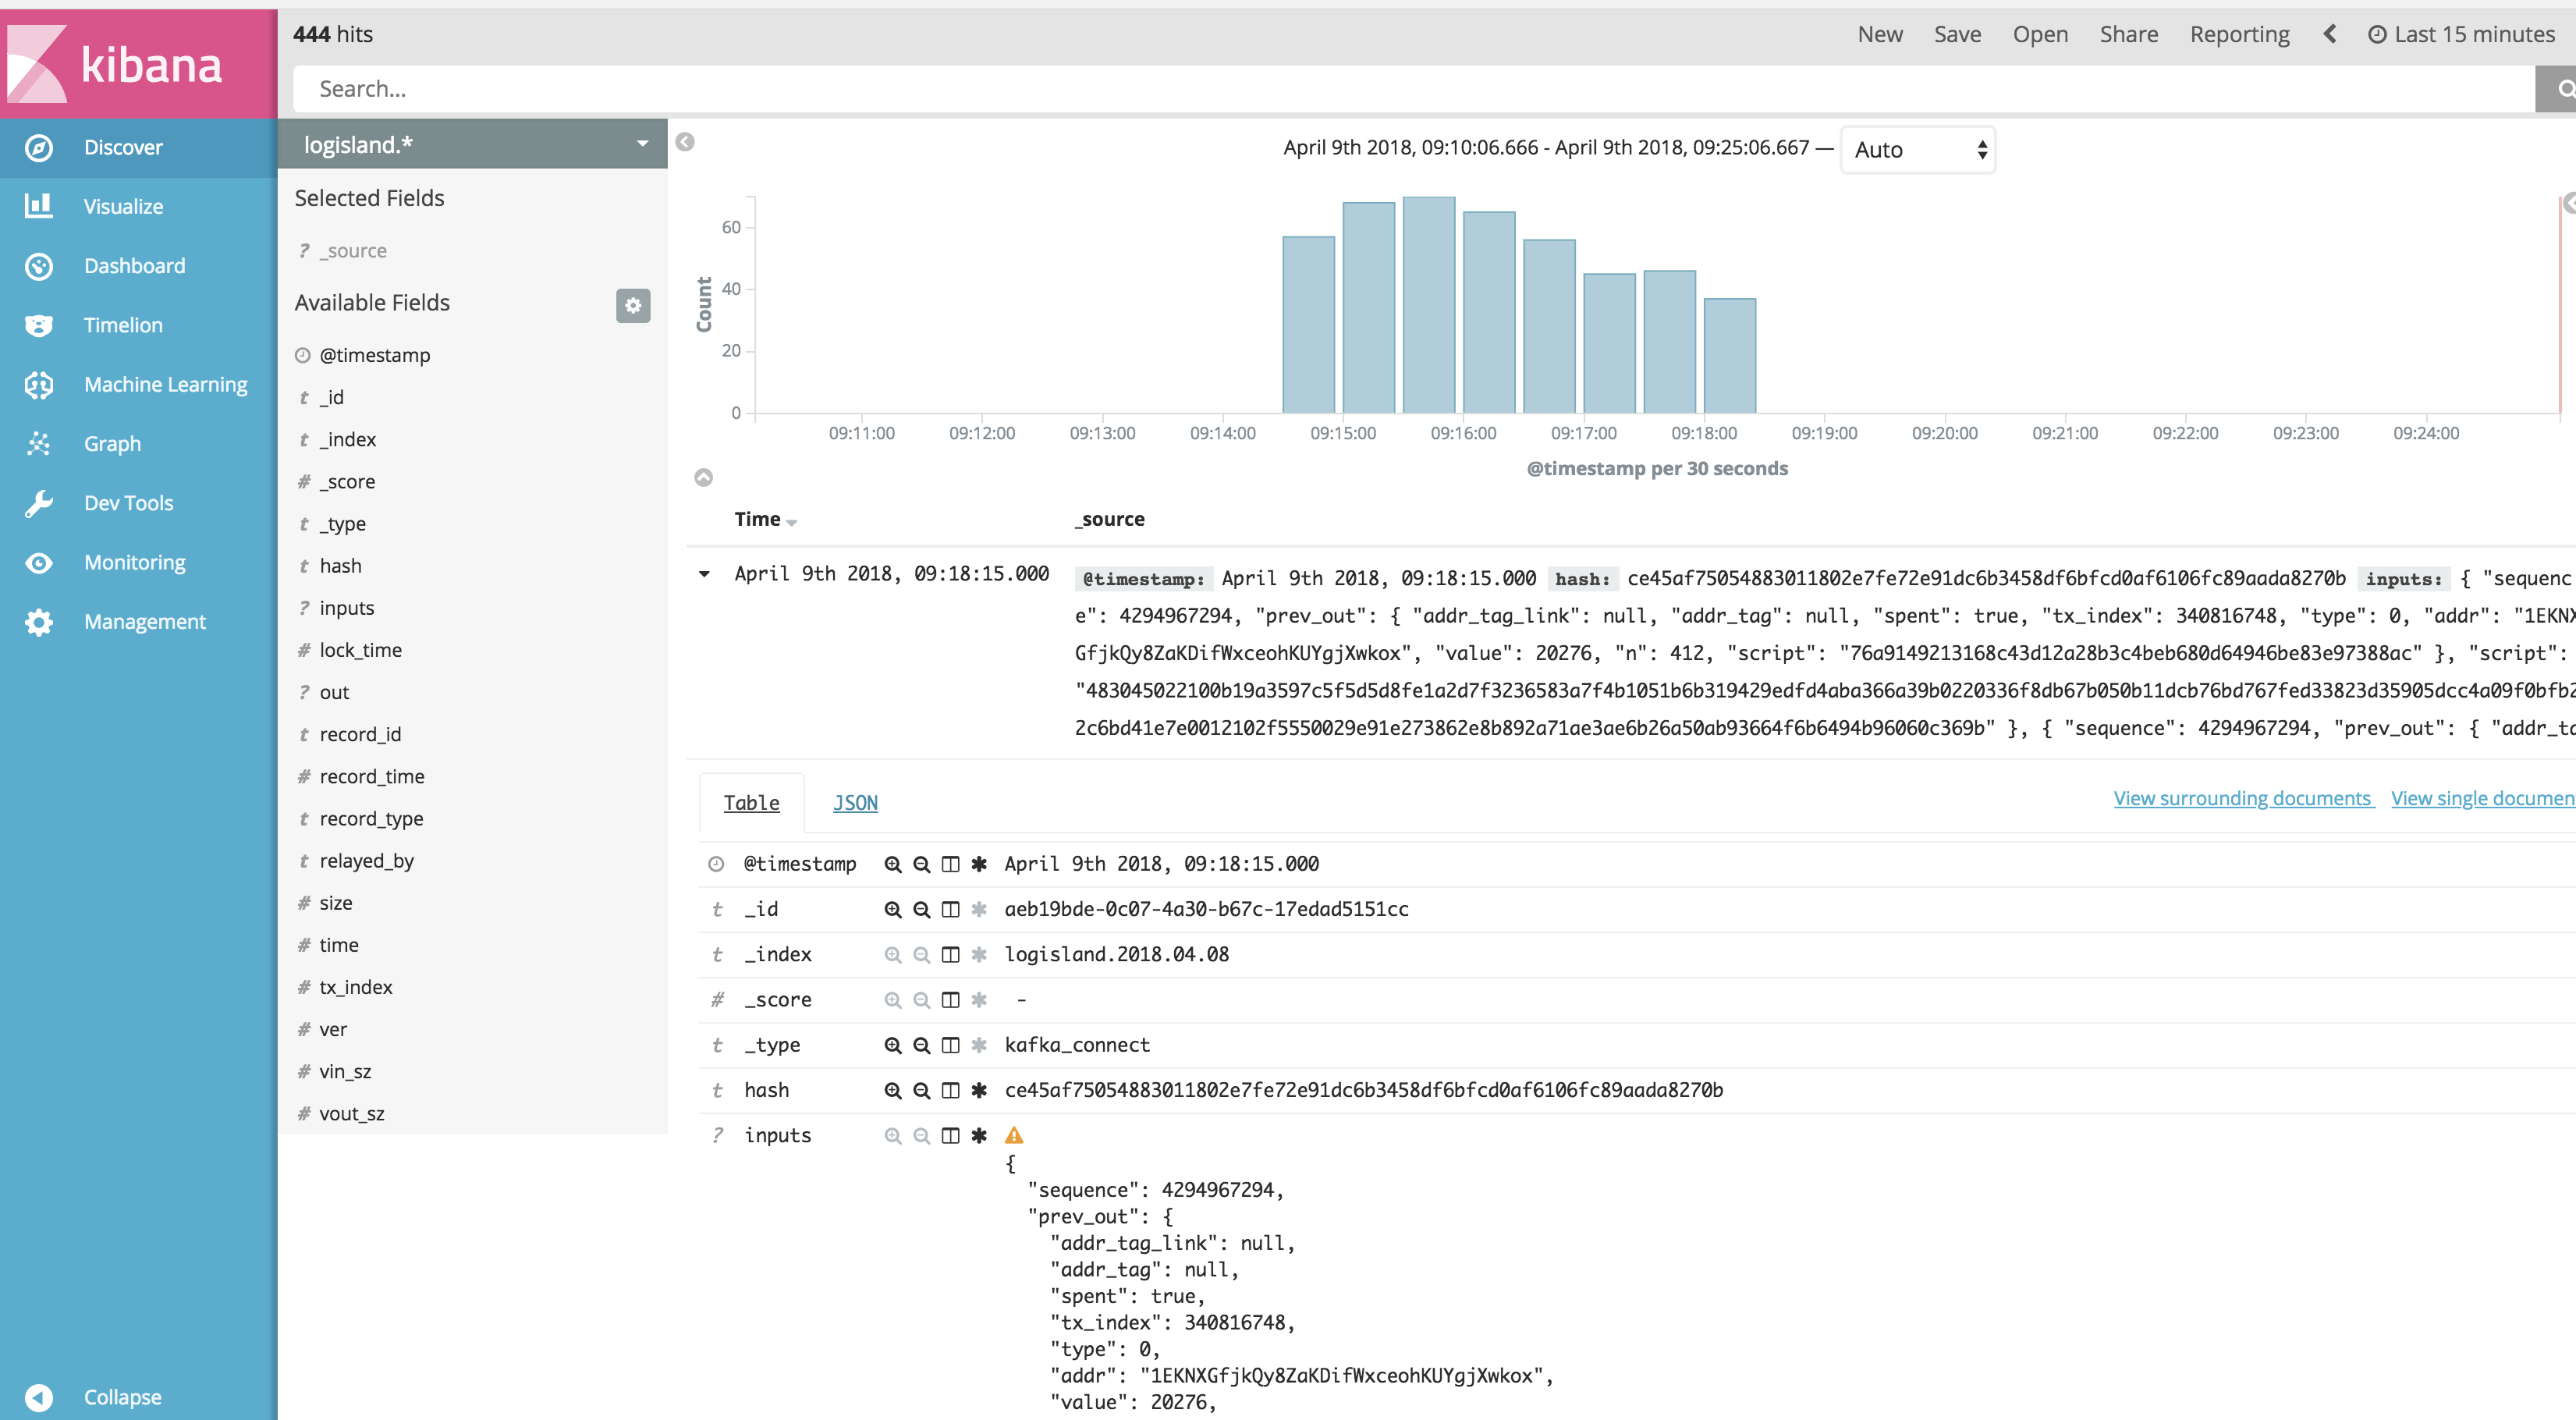
Then if you go to Explore panel for the latest 15’ time window you’ll only see logisland process_metrics events which give you insights about the processing bandwidth of your streams.
You can try as well to create some basic visualization in order to draw the total satoshi transacted amount (aggregating sums of out.value field).
Below a nice example:
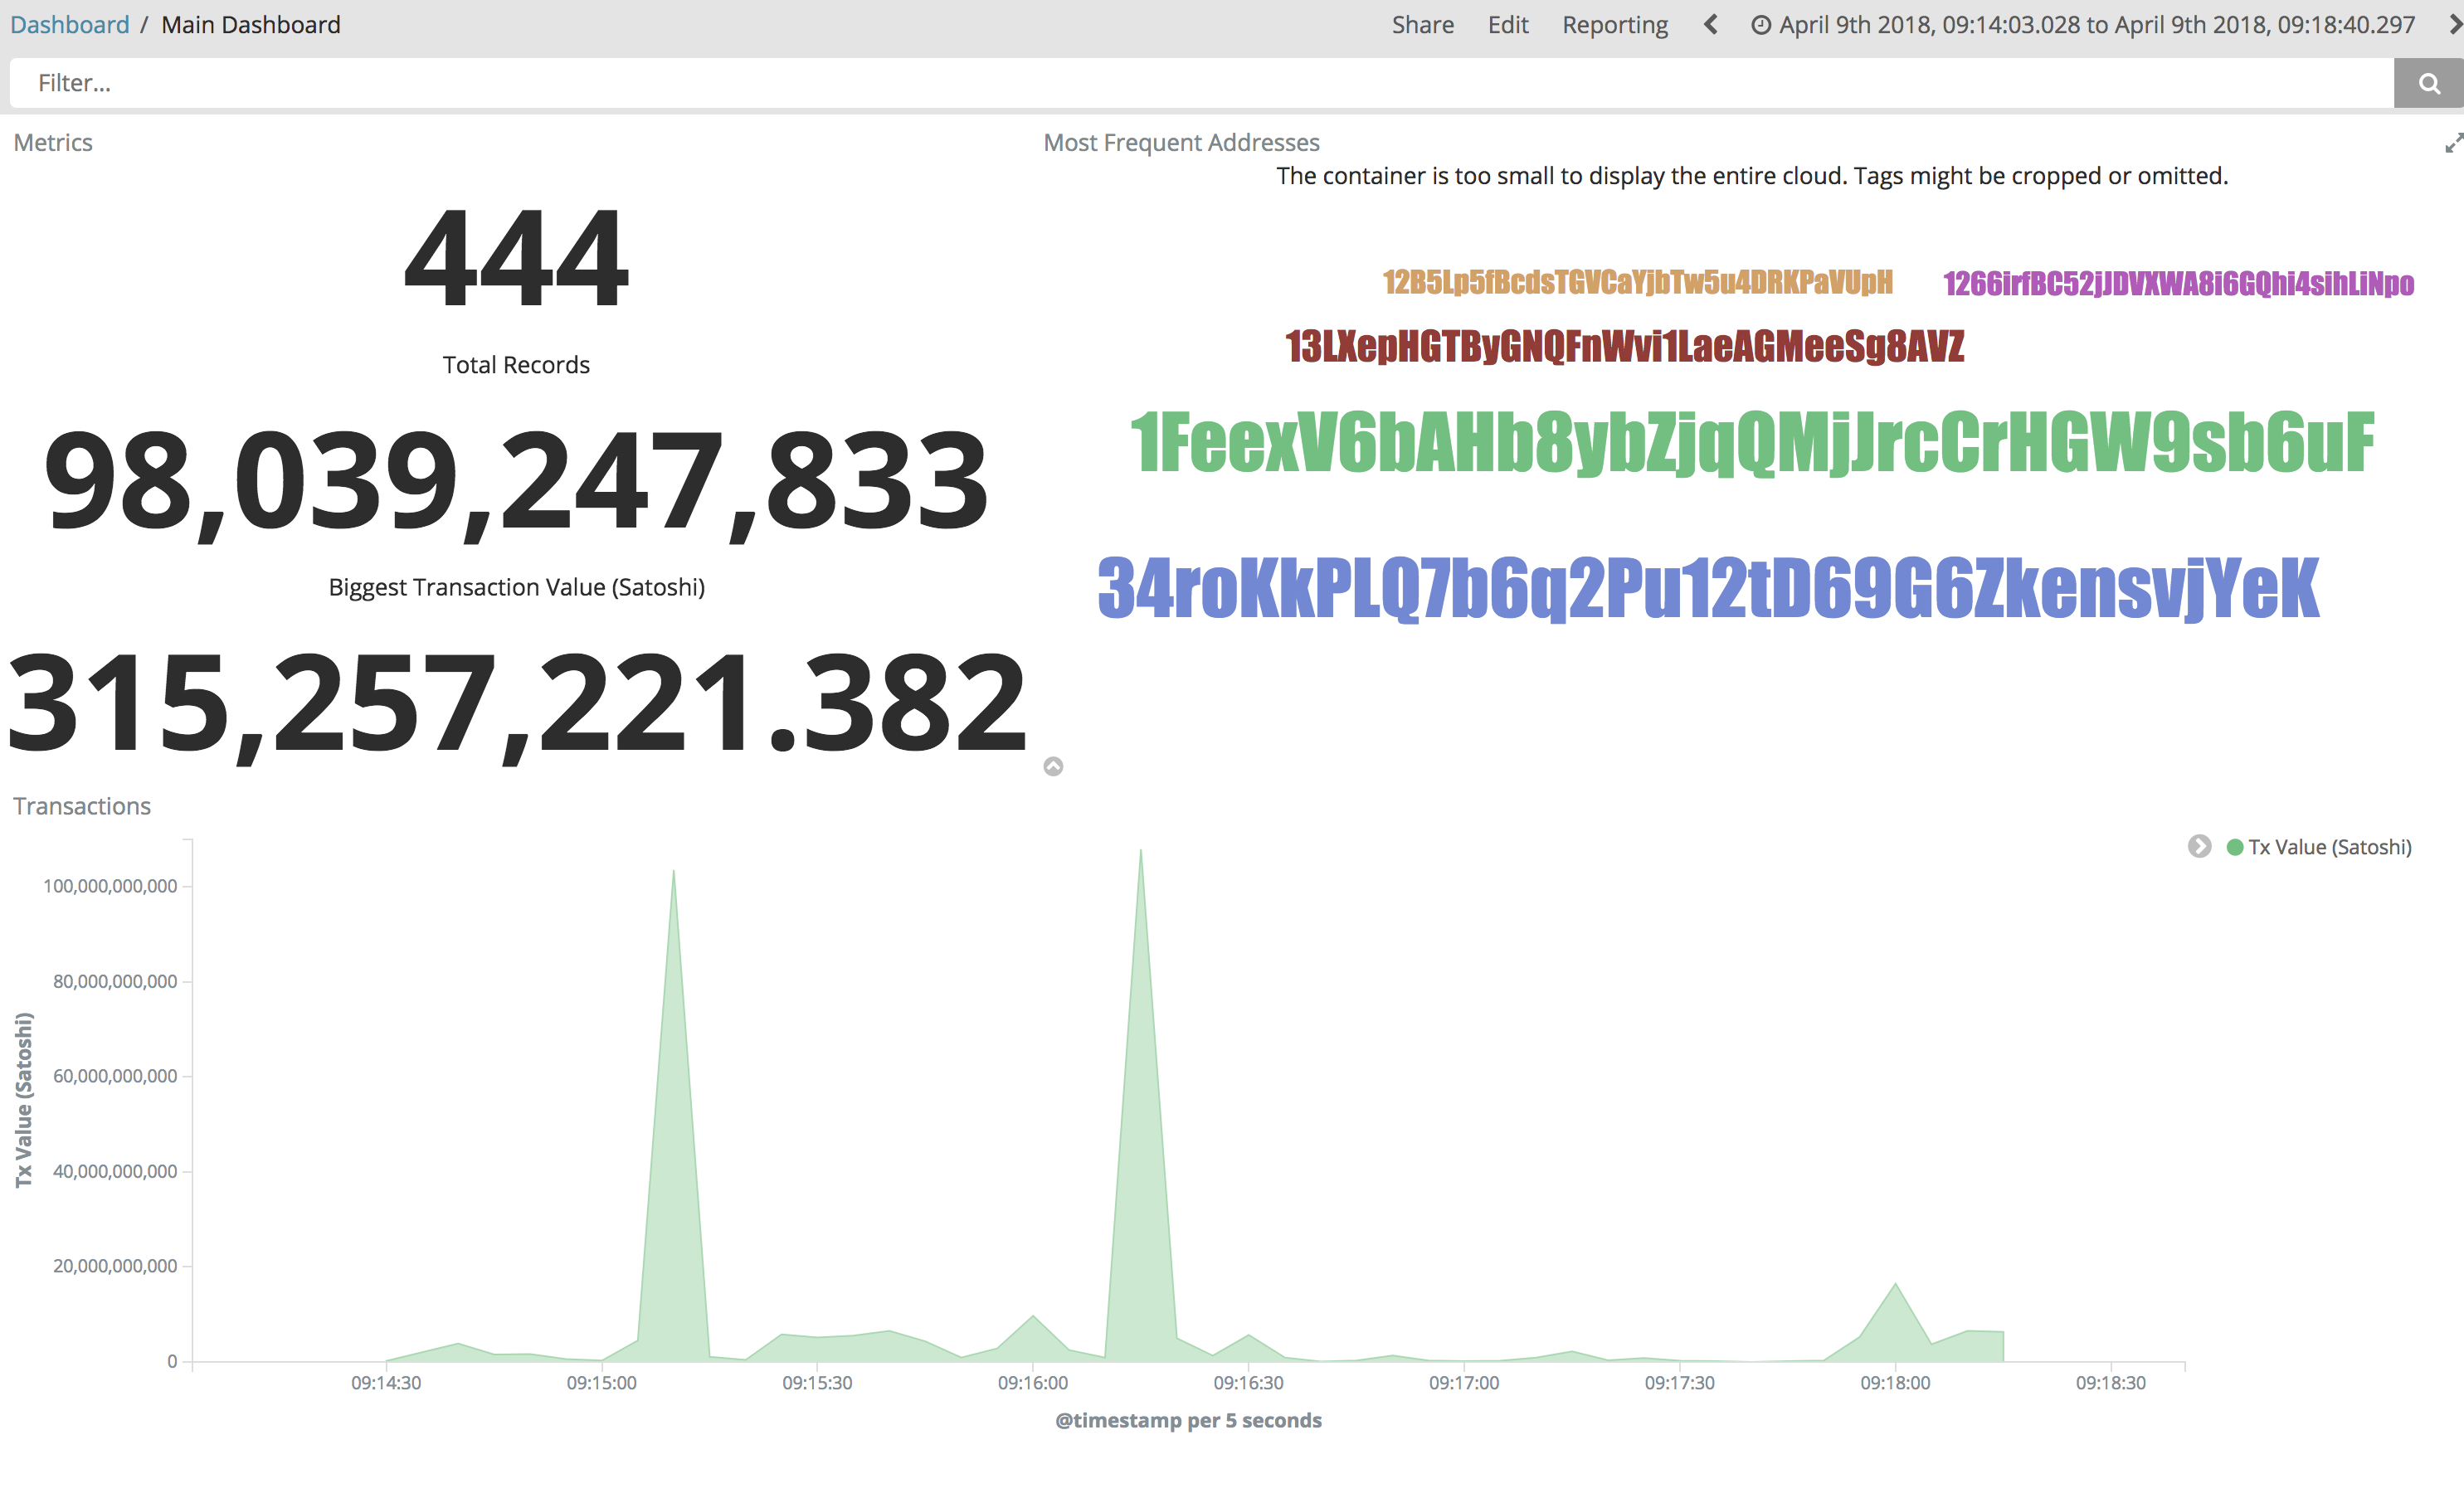
Ready to discover which addresses received most of the money? Give it a try ;-)
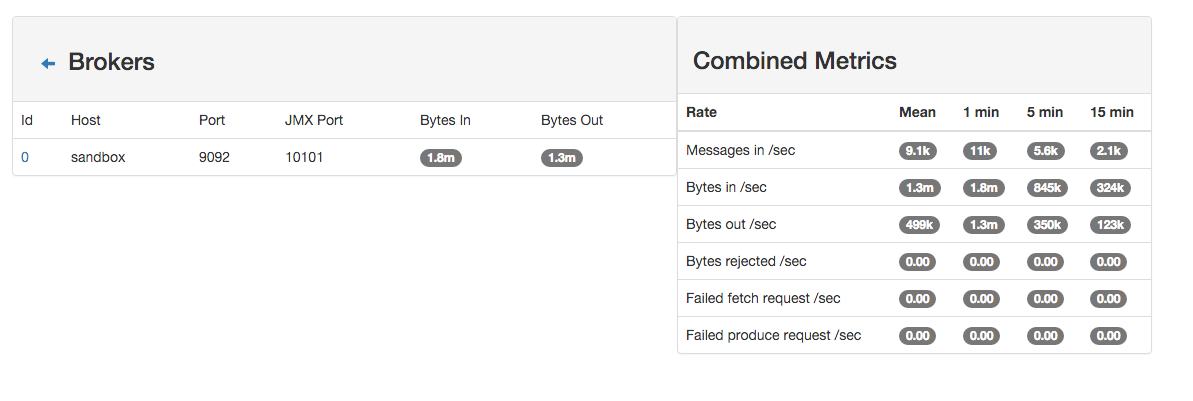
4. Monitor your spark jobs and Kafka topics
Now go to http://sandbox:4050/streaming/ to see how fast Spark can process your data
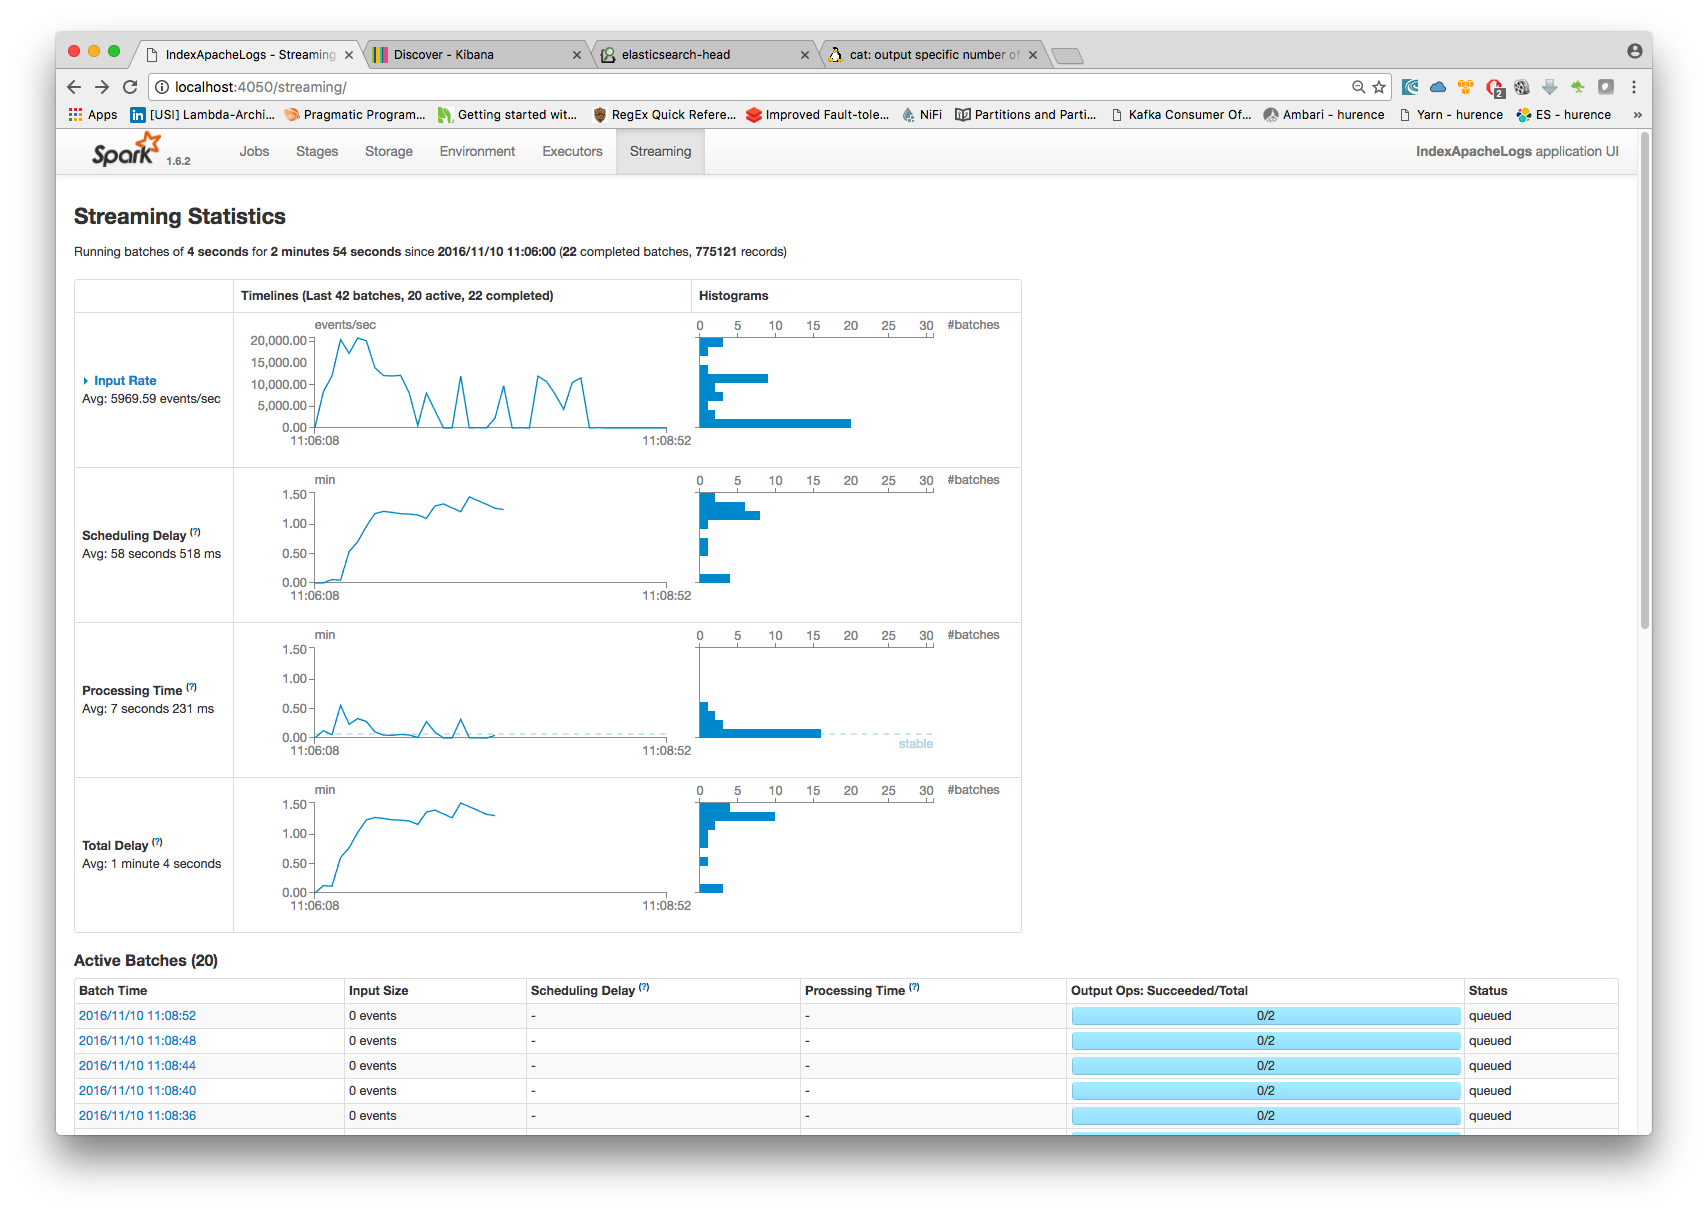
Another tool can help you to tweak and monitor your processing http://sandbox:9000/